The tutorial introduces the components of the Gantt view.
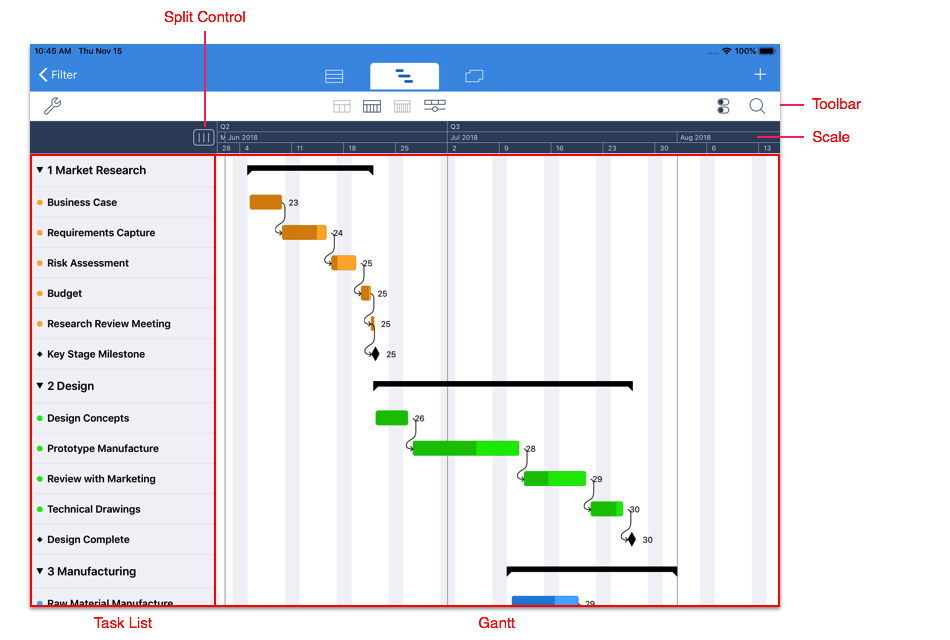
The image above shows the main components of the Gantt View.
The Task List contains a list of the tasks in the project.
The Gantt chart displays horizontal ‘Task Bars’ that represents the tasks on a horizontal time scale.
The Split Control is used to adjust the width of the Task List.
The Toolbar contains buttons and menus that provide additional control over the information displayed in the Gantt View.
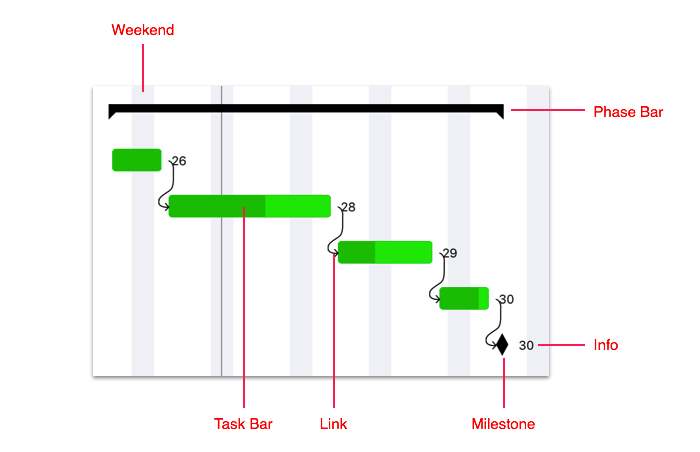
The key elements of the Gantt view are illustrated in the image above.
The background of the Gantt contains vertical separators to indicate the time scale. The grey lines represent the Weekend separating weeks.
The Task Bar represents a task on the Gantt view such that the left edge aligns with the task’s start date and the right edge aligns with the task’s end date.
The arrow connecting two tasks is a Link that indicates a parent child relationship between two tasks.
A Milestone is represented by a black diamond.
On the right side of each bar is the Info component which displays information about the task. In the example above the number represents the ‘Week Number’ of the end date of the task. The info can be customized to display different task information.
The black horizontal line above the tasks is called the Phase Bar and represents the overall duration of the Phase.