This tutorial shows the basic features of a report.
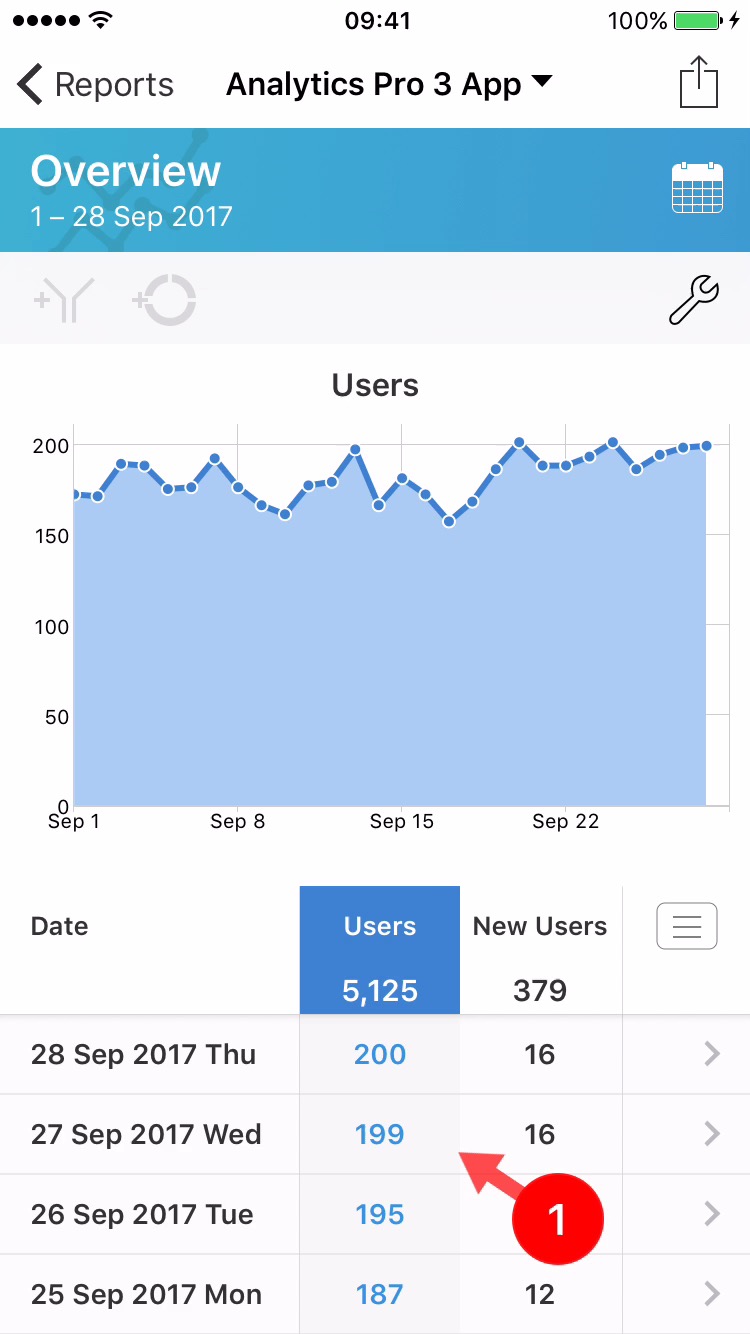
1Drag horizontally and vertically to scroll the data.
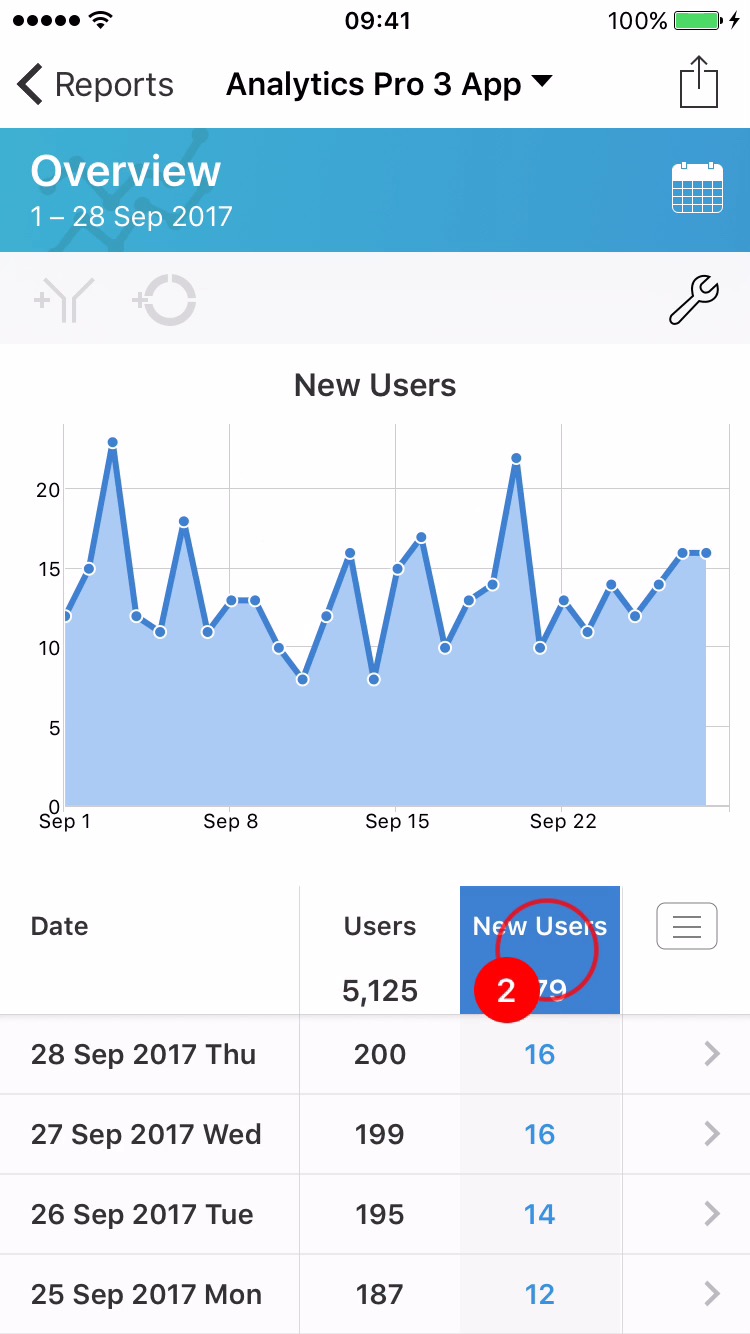
2Tap the Row Header to change Metric.
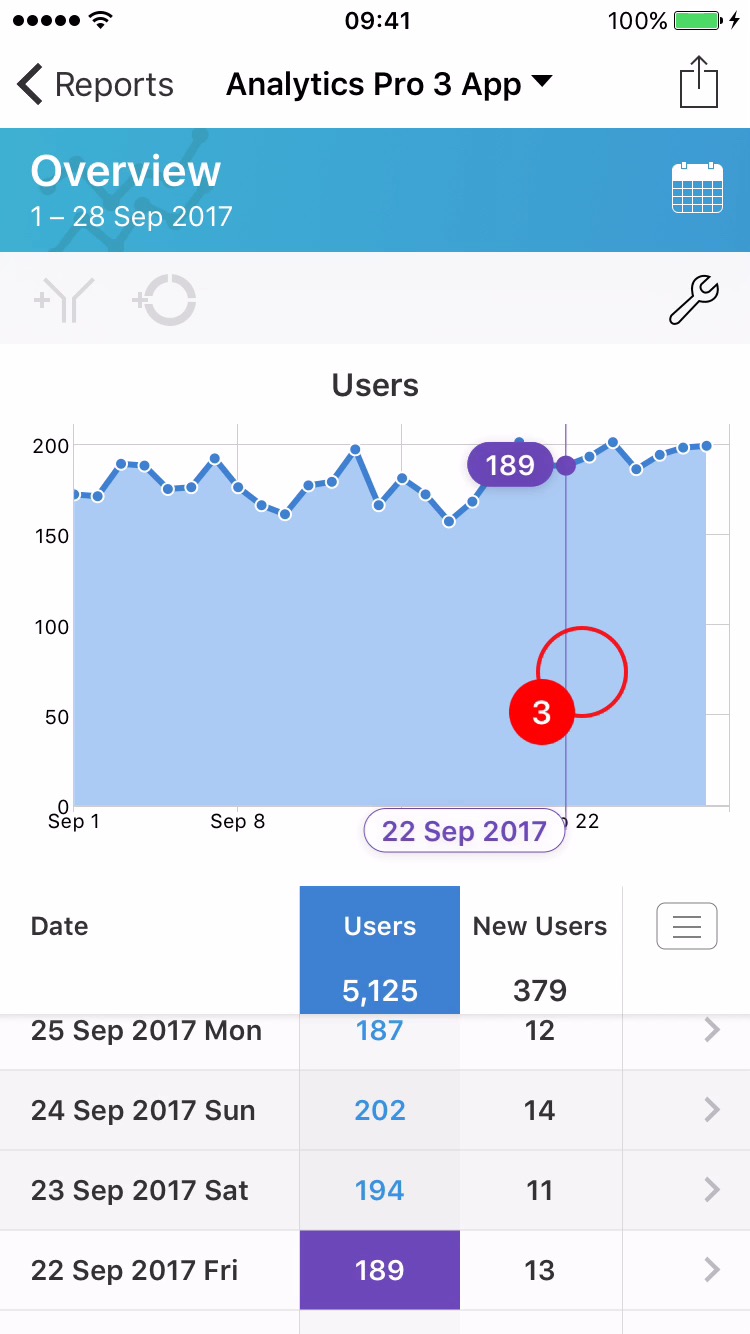
3Tap on a graph to display metric values. The metric value will be displayed on the graph (in purple) and the corresponding data point will be highlighted in the data table.
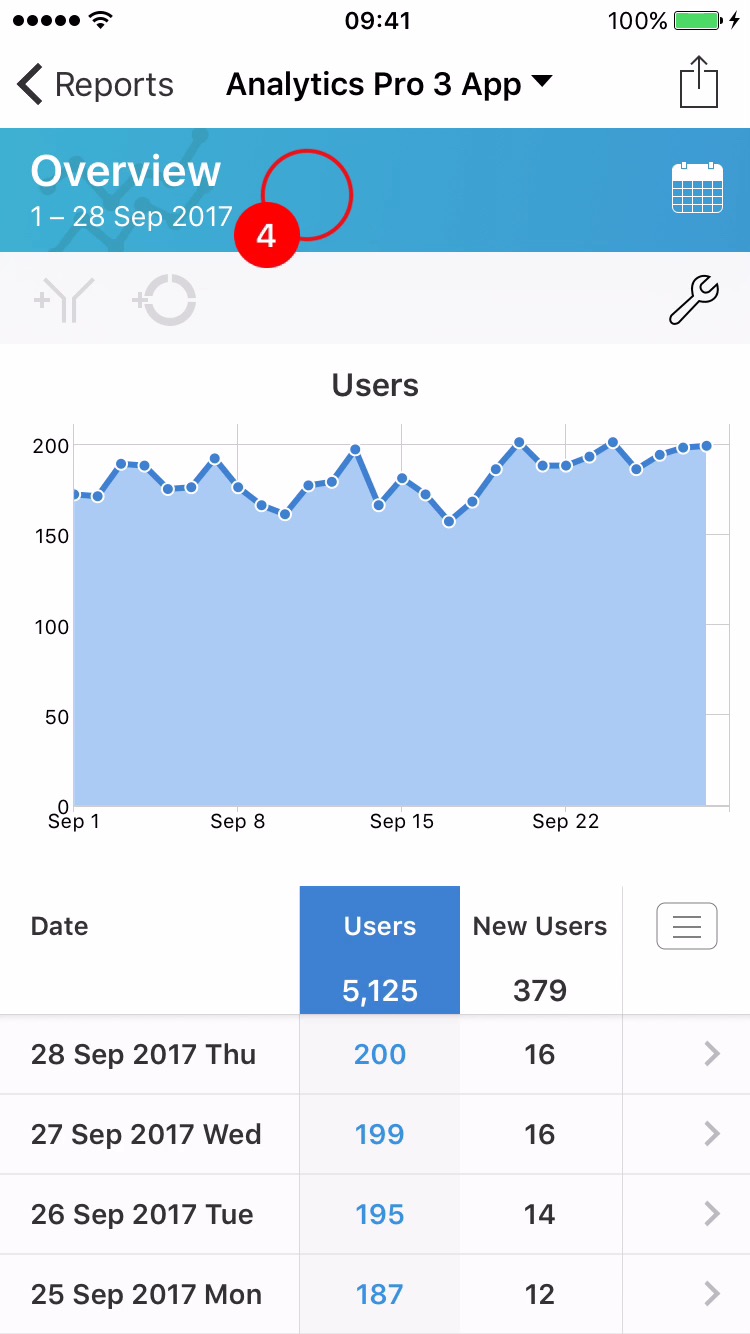
4The report title and date range are displayed above the report.