Analytics Pro 2 is a Universal App which works on both the iPhone and iPad.
If you have more than one Google Account, you can switch accounts without leaving the current report.
Analytics Pro 2 supports Split View on iPad and 3D Touch on iPhone.
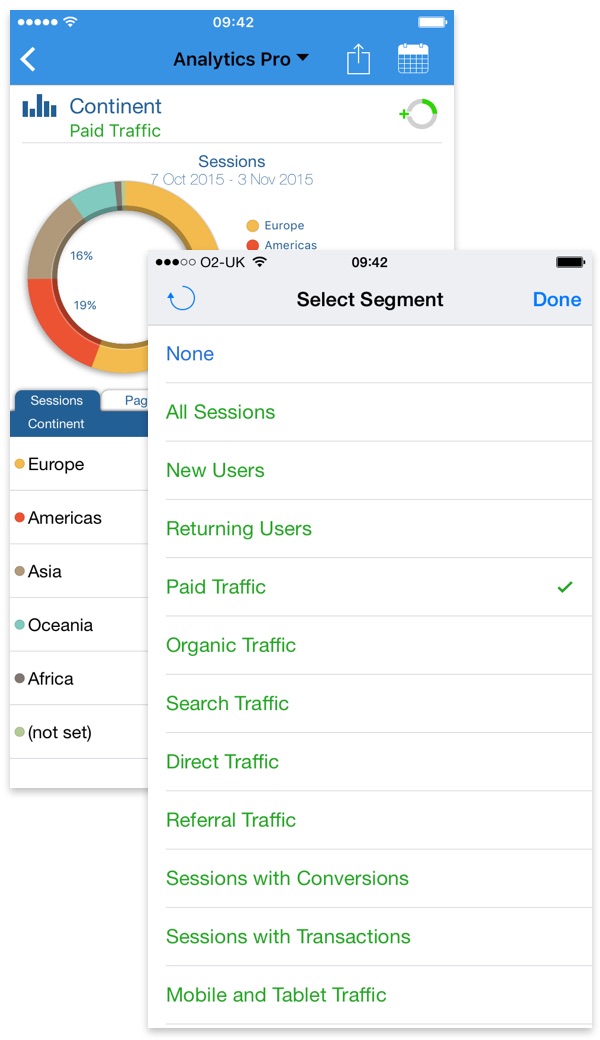
Segments let you isolate and examine subsets of your data.
To apply a segment to a report, just select a Segment from the list of Segments.
The selected Segment is displayed below the report title in green text to indicate that a Segment is being applied to a report.
With Analytics Pro it is easy to drill down into your data to identify trends and refine your analysis. Navigation is intuitive and easy to use.
iPhone 6s introduced 3D Touch, and Analytics Pro 2 supports Peek and Pop that lets you preview a report without having to open it.
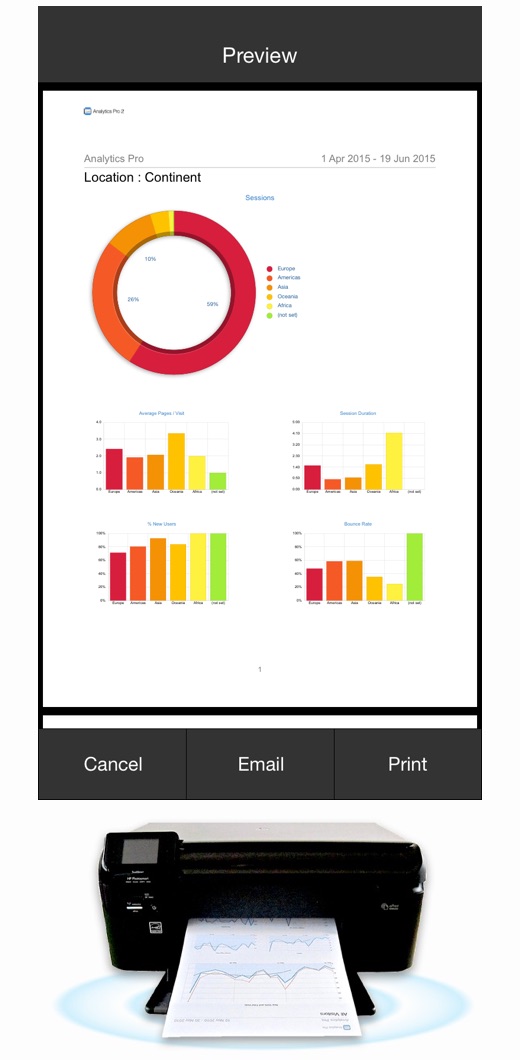
Export high quality PDF reports by email and export data as a Text file. Customize and Preview reports before Printing or Exporting.
AirPrint makes it simple to print reports right from your iPhone or iPod touch.
A few taps is all it takes to go from viewing it onscreen to holding a printed copy.
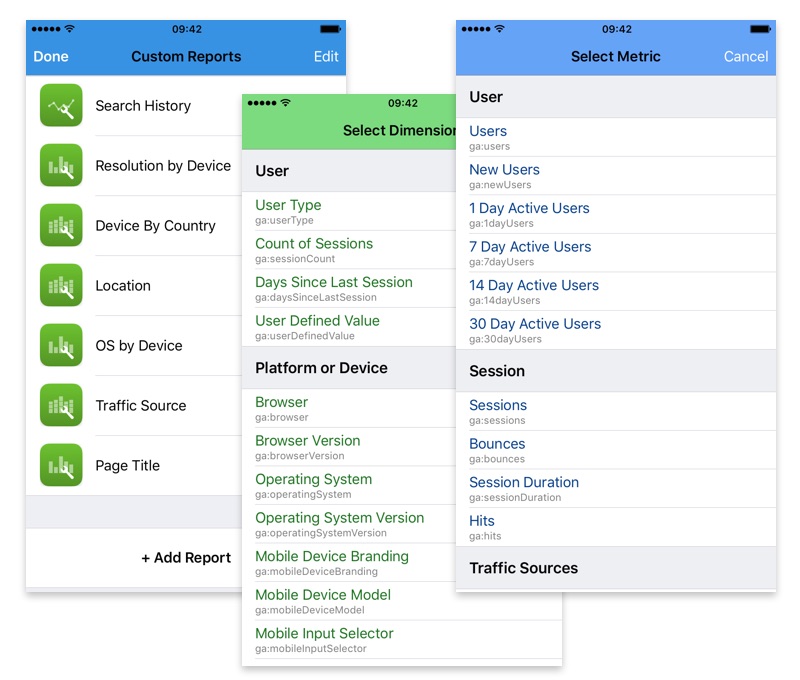
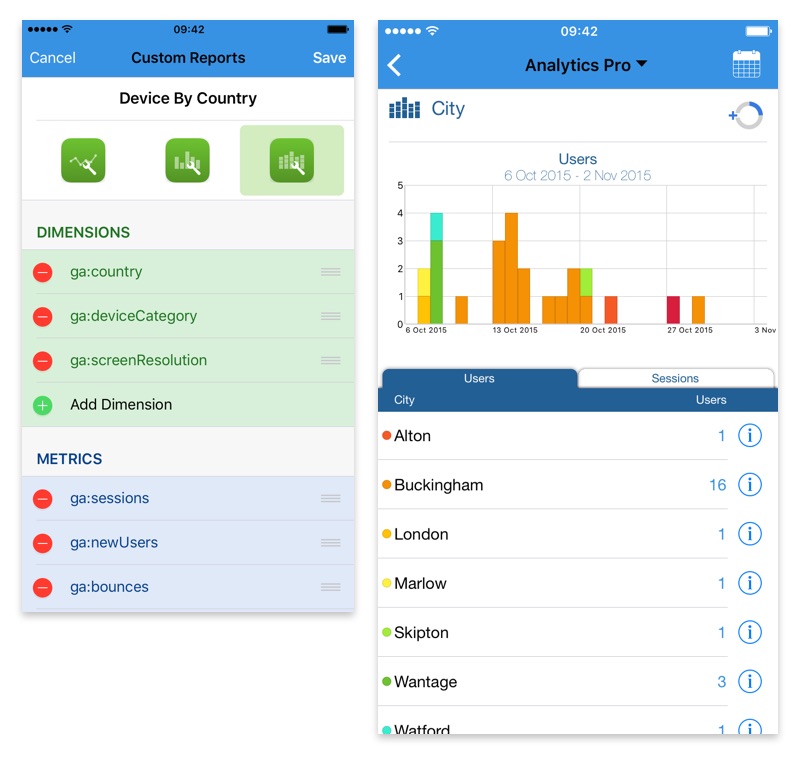
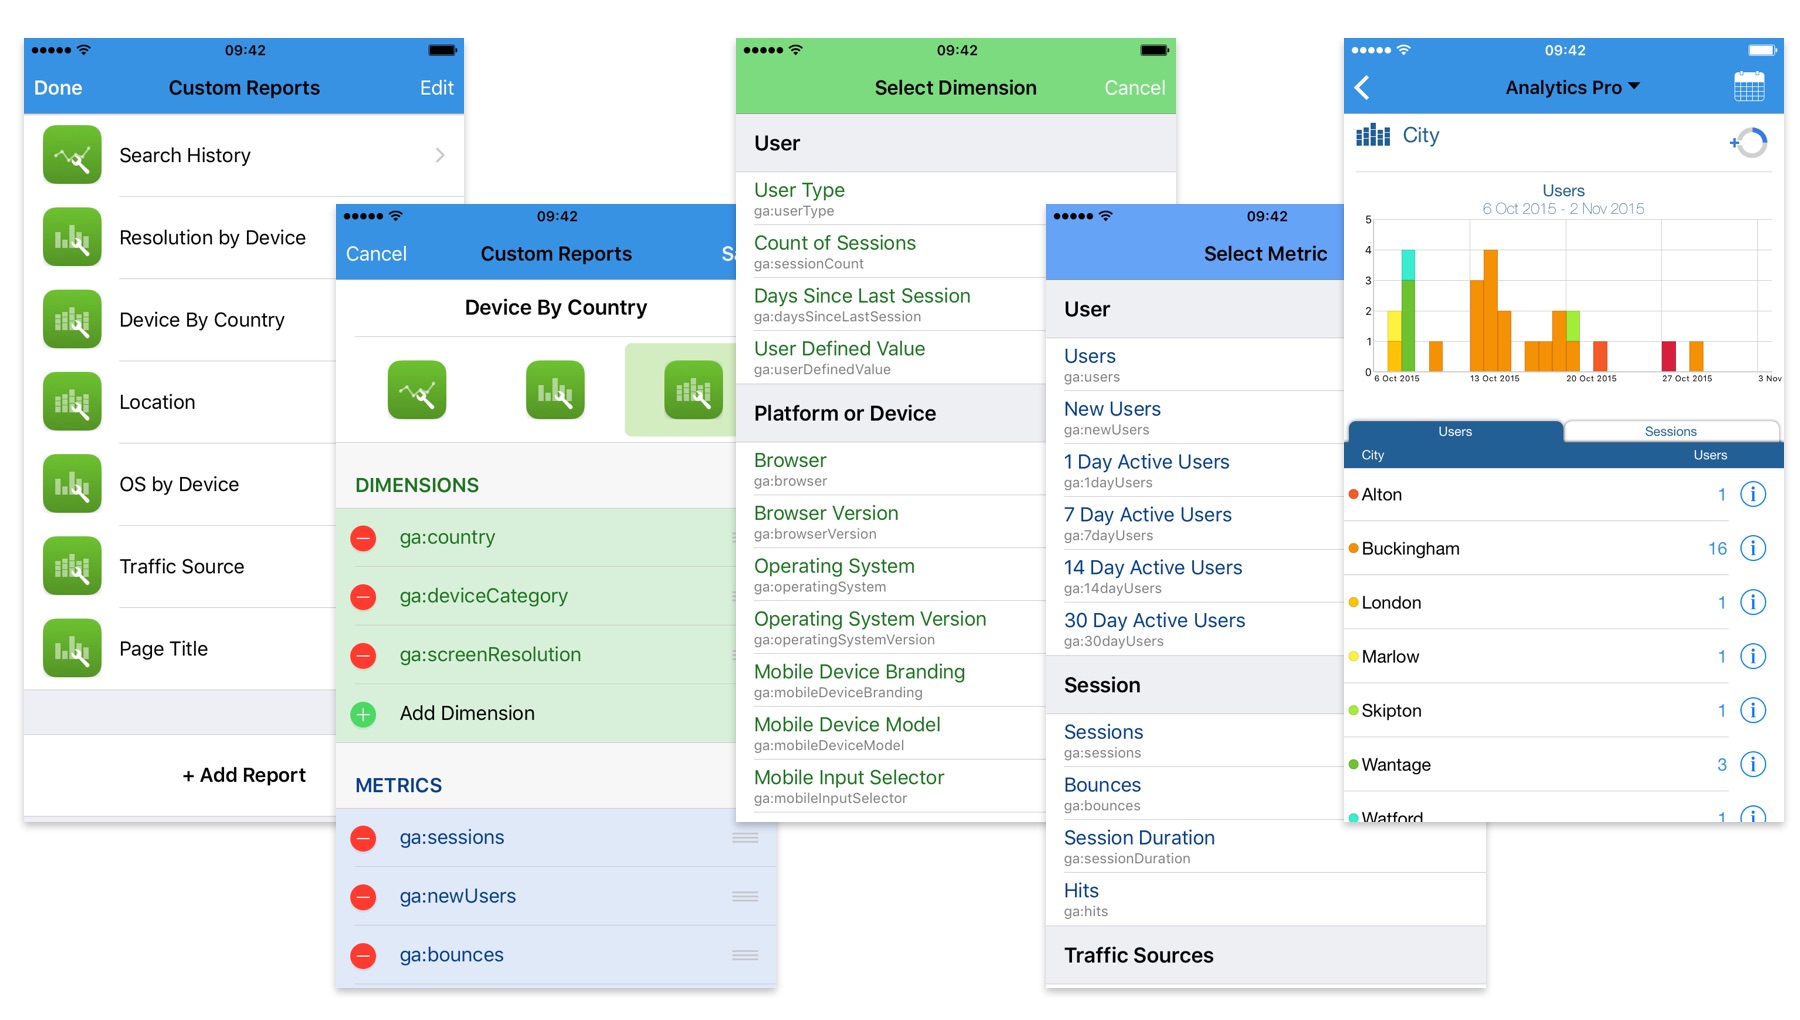
For the first time, you can now create your own custom reports. Custom Reports put the full power of Google Analytics at your fingertips.
There are 3 report templates available, including a new stacked dimension graph which lets you analyze how dimensions and metrics change over time.
To create a Custom Report, just select the Dimensions and Metrics to include in the report and adjust the order as desired.
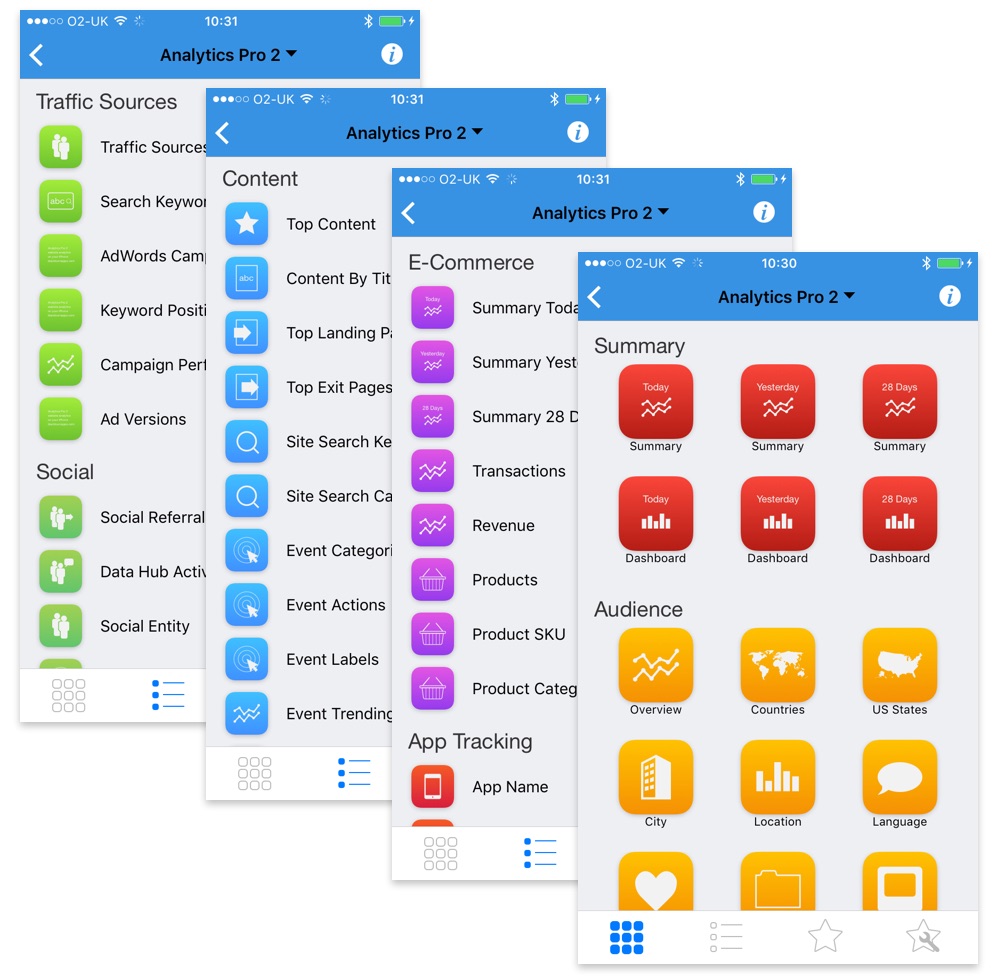
The report menu facilitates finding and selecting reports in either a grid or list based layout. 65 Reports organised into 8 sections, give more than 175 drill-down combinations allow deep insight into your data.
With so many reports available, the favorites tab helps by displaying only those which you like to view regularly.
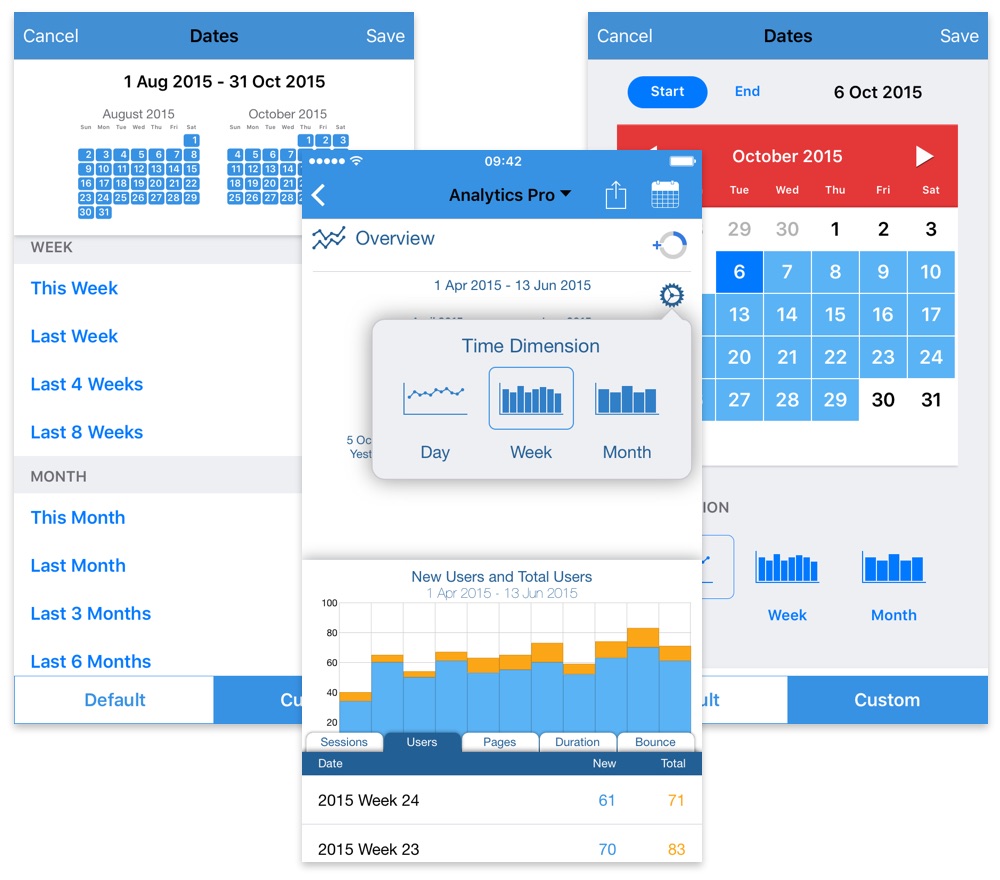
A new Date Picker UI provides easier date range adjustment including date range presets. Custom date ranges are now stored for re-use amongst other reports.
Day, Week and Month dimensions make it easier to visualise large date ranges and spot trends.
The Summary and Dashboard reports provide a quick way to see how your websites are performing Today, Yesterday or for a customizable date range.
The Summary report gives you a snapshot of recent visitor activity on your site in 9 sections:
The Dashboard report gives you a snapshot of recent visitor activity presented visually with graphs and charts.
With 20 Audience reports to choose from, you can gain a complete understanding of your users.
Reports display multiple data metrics such as Visits, Page Views, Time on Site, New Visits and Bounce Rate.
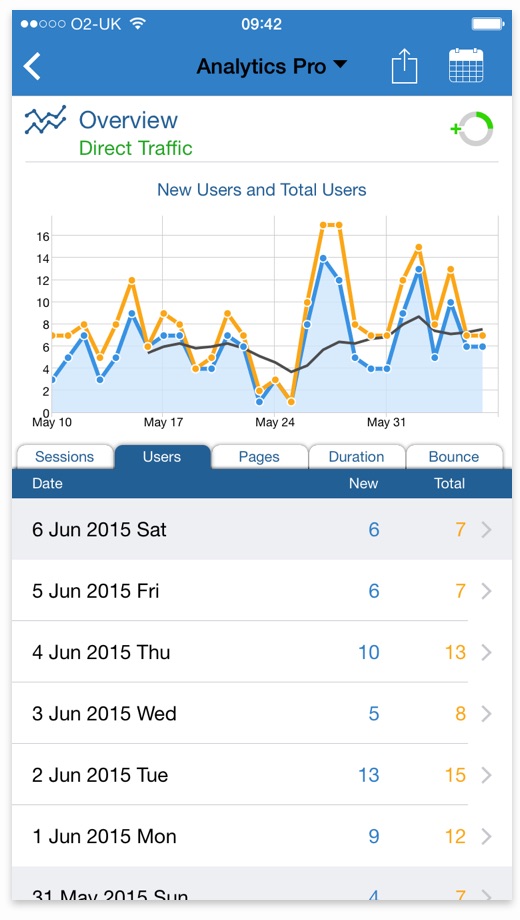
The Overview report helps explore Daily and Hourly trends for the User, Session, Page View, Duration and Bounce Rate metrics.
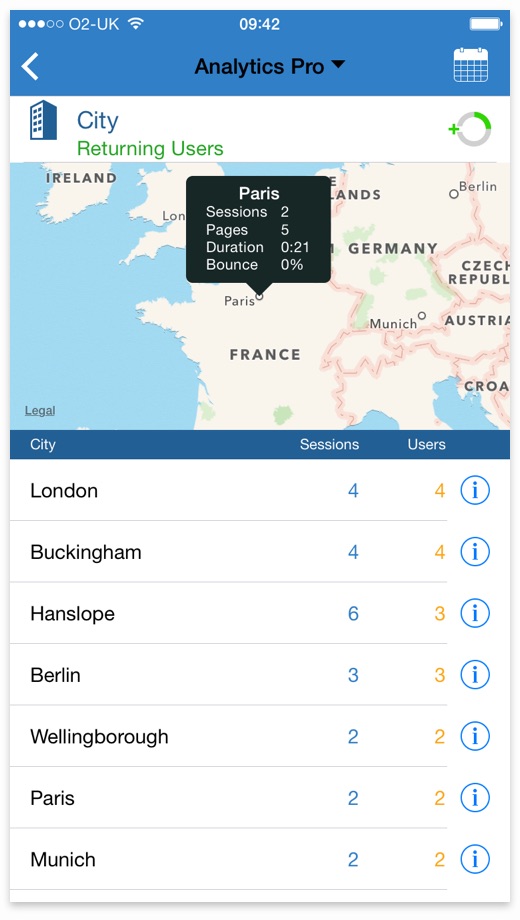
The Location report to identify the Continent, Country, Region and City of users.
The Visitor Loyalty report helps understand in more detail how many times and how often users visit to your website.
The Age Bracket, Gender, and Interest reports learn more about your users.
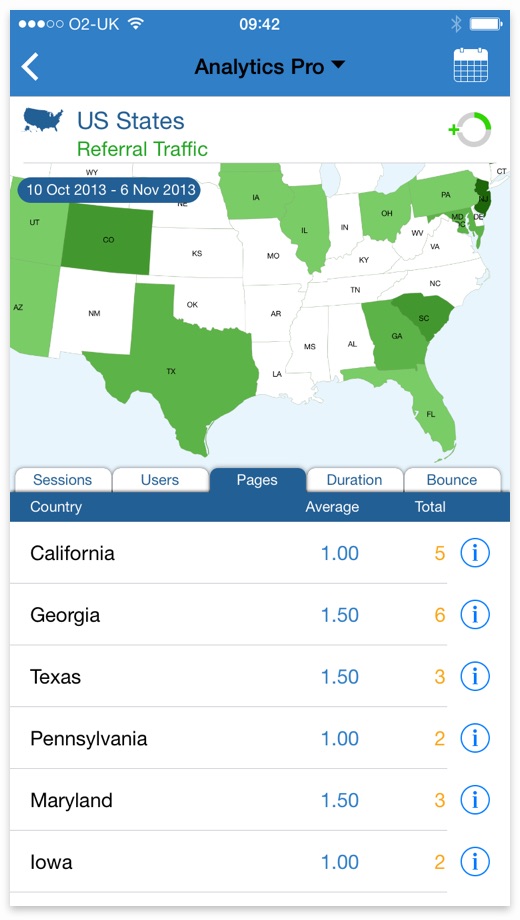
The Countries, US States & City reports visually explore visitor location using maps. World Countries and US States can now redraw the map to display 5 metrics.
The World Map with Pan and Zoom function enables you to easily visualise where your visitors are coming from.
There are 11 reports help understand what technology is used to access your website.
The Traffic Sources report shows where your visitors come from, including links that display the actual web page that your visitors came from.
The Search Keywords report shows the Search Keywords visitors are using to find your site.
Adwords Campaigns summarizes sessions, users, pages and duration for your Adwords Campaigns.
Keyword Positions shows metrics for Ad Slot, Keyword and Ad Position.
Campaign Performance shows Daily Trend Graph for CPM/C, CTR, Ad Cost, Impressions & adClicks.
Ad Versions summarizes Ad Content for each Campaign.
Identify the most popular pages on your website with 4 Content Reports.
The Site Search report shows user metrics for site Search Keywords and Categories
There are 4 reports to monitor Events. Event Information can be viewed as separate Categories, Actions or Labels, with drill a down option to refine your analysis.
Event Trending shows a daily trend graph of Events. Select any day to drill down and view your Event Categories, Actions and Labels for the selected day.
The Site Speed helps understand page loading times and server connection times for your website.
The Social Referral report helps understand how users arrive at your website via a Social Network referral.
Data Hub Activity reports the activities where content is shared or mentioned on a social data hub.
Understand Social Actions by Entity and Source with the Social Entity, Social Source and Social Source & Action reports.
Three Goal Reports allow you to monitor your site Goals.
The reports summarize Goal Starts, Goal Completions and Goal Value and allow you to monitor daily, weekly and monthly trends.
The Goal Flow report lets you filter Goals by source or medium.
For Apps that use Google Analytics, there are five App Tracking reports to display App analytics data.
The App Name report enables you to keep track of App Screen Views. Filter by App Name, App Version and Screen Name.
The Screen Name report all monitor the screen views to identify which screens are most popular and the time spent on each..
The Landing & Screen Name reports show which screens users start and end their app usage.
The Crashes & Exceptions report helps to identify and prioritize issues affecting your apps.
Summary Reports for Today and Yesterday showing hourly graphs and summary data.
The Summary Reports include:
The Transactions report shows the Daily Trend Graph. Drill down through your data to see the Transactions and Purchases for any day. Includes:
The Revenue report includes:
The Products, Product SKU & Product Categories provide individual Summary Reports for Products, SKUs and Product Categories.