Multiple Accounts and Profiles.
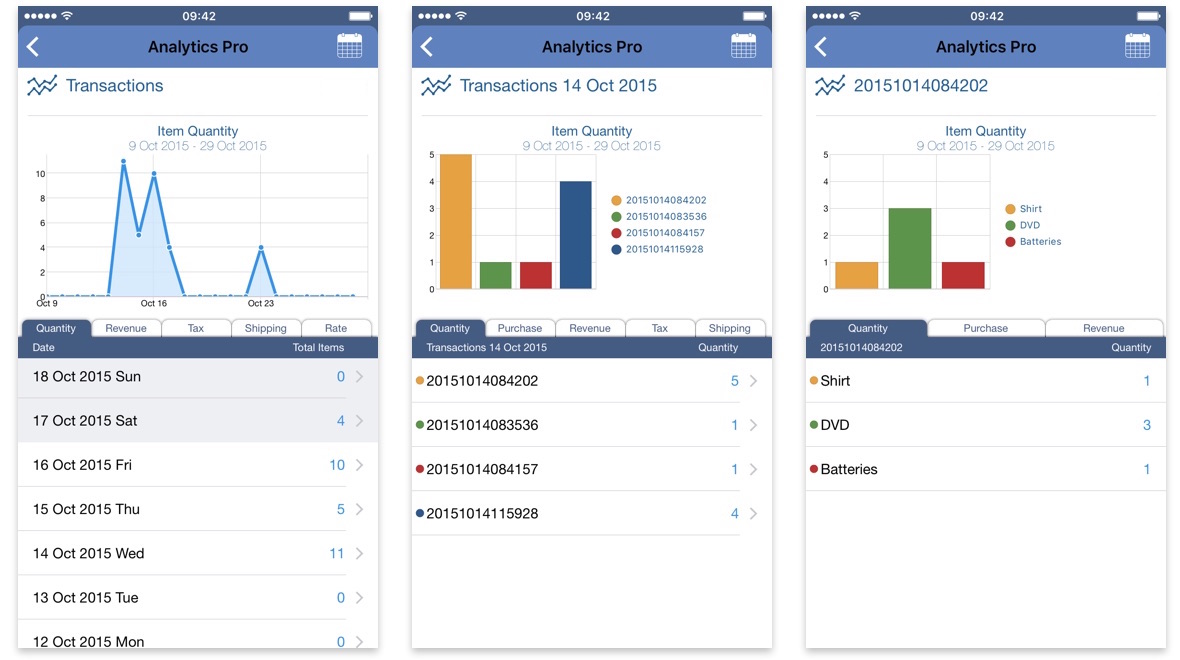
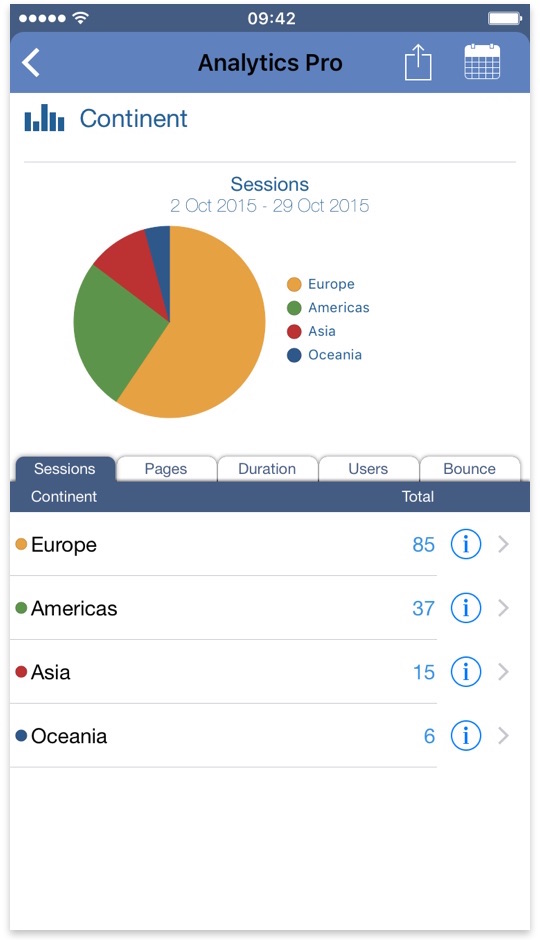
Drill Down through your data.
Fast on 3G, Wifi or Edge.
Multiple Graphs and data for all metrics.
Portrait and Landscape Graphs & Maps.
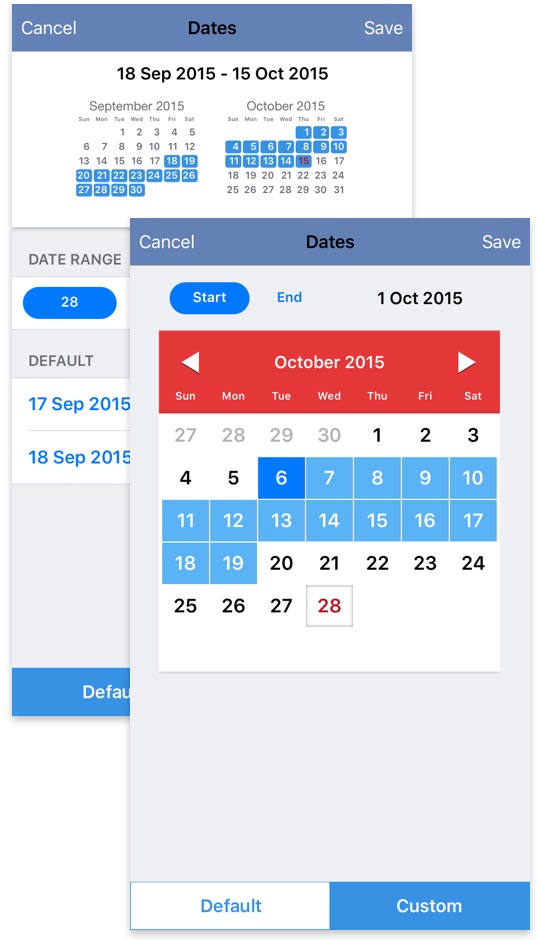
Intuitive Date Picker for setting the Date Range.
Analytics Pro uses the Google Analytics™ API to transmit and receive data.
Google Sign-In is used to authenticate directly with Google. No third-party servers or intermediaries are used.
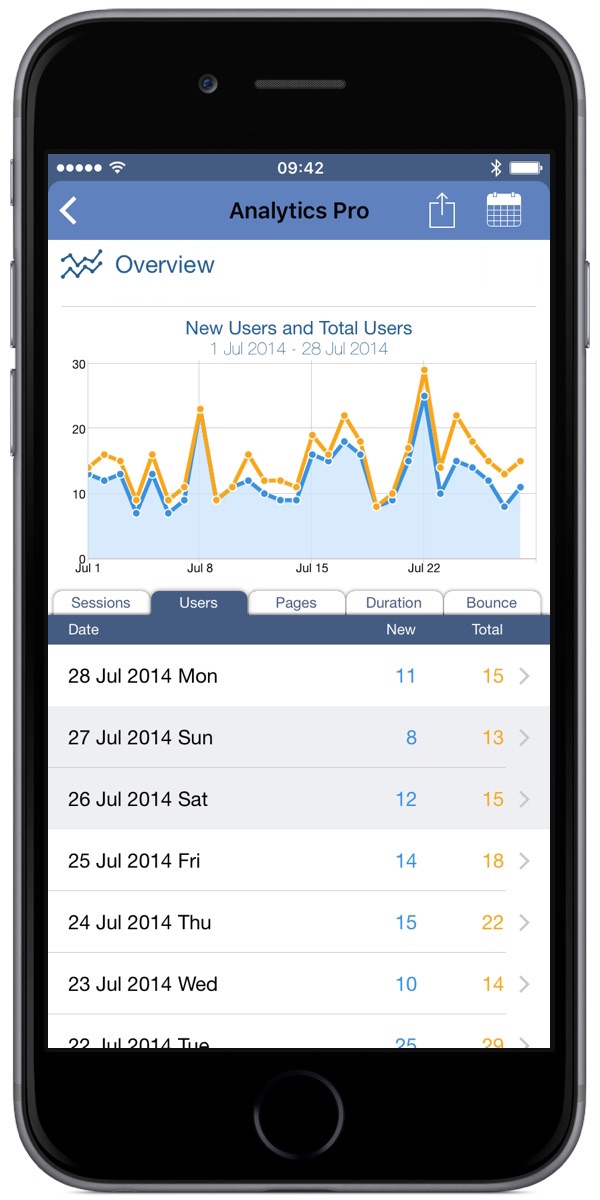
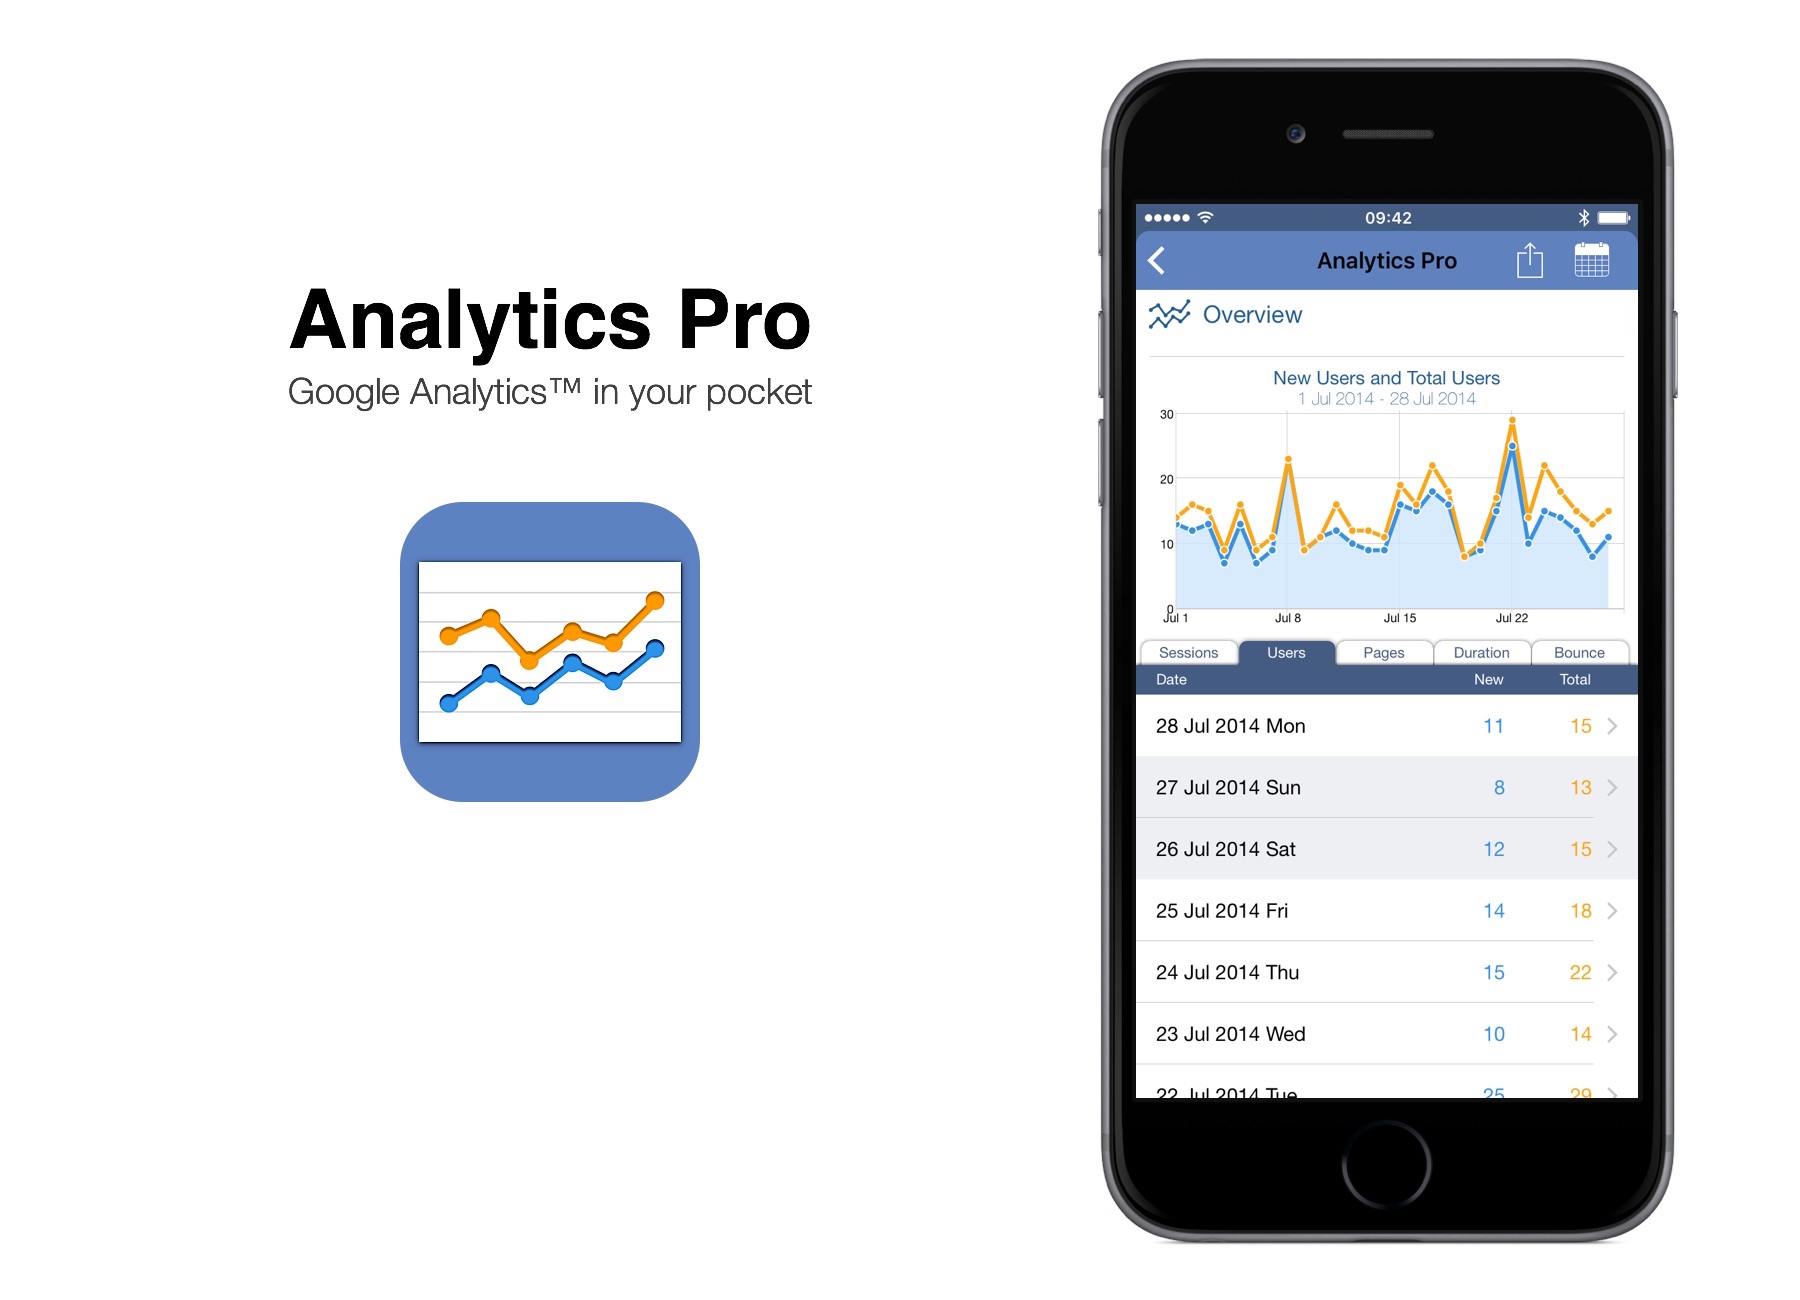
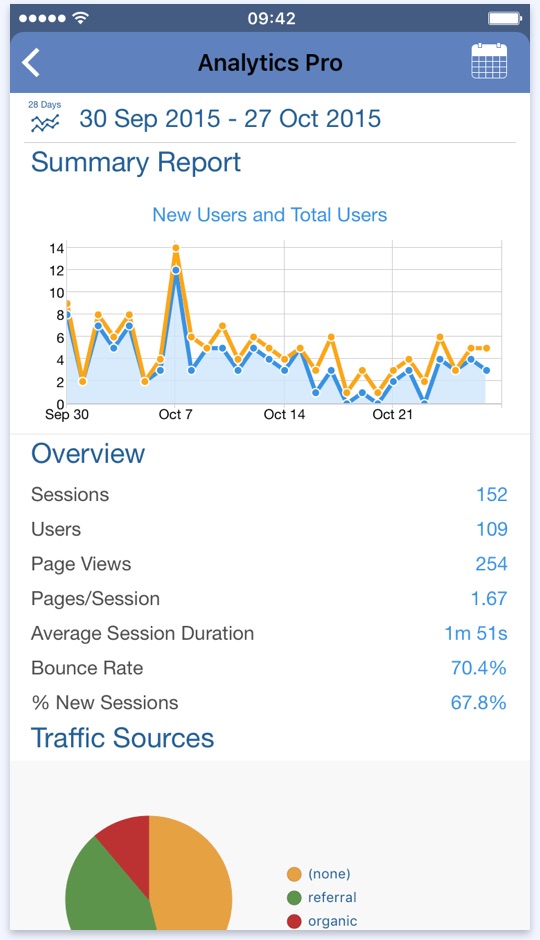
Reports display multiple data metrics such as Sessions, Page Views, Time on Site, New Users and Bounce Rate.
Rotate your iPhone for Full Screen Graphs and Maps.
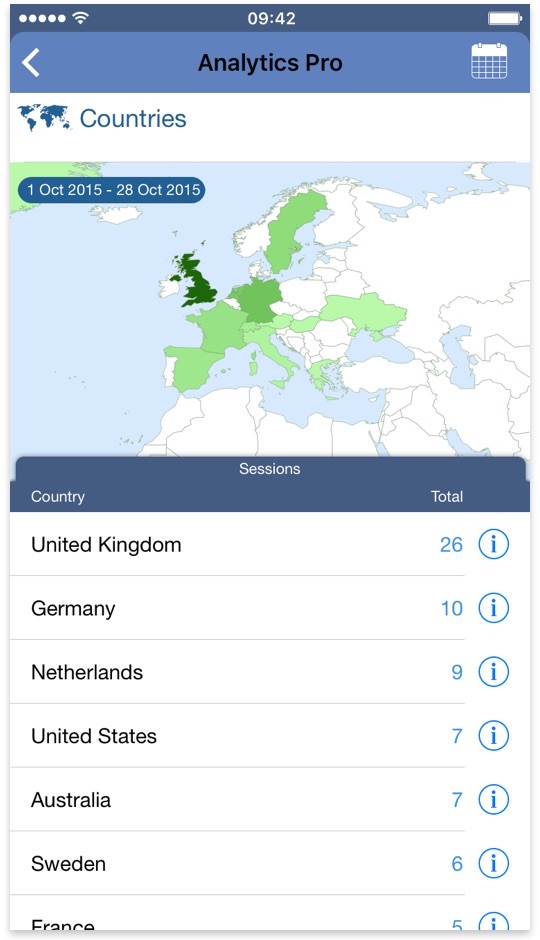
The World Map with Pan and Zoom function enables you to easily visualize where your visitors are coming from.
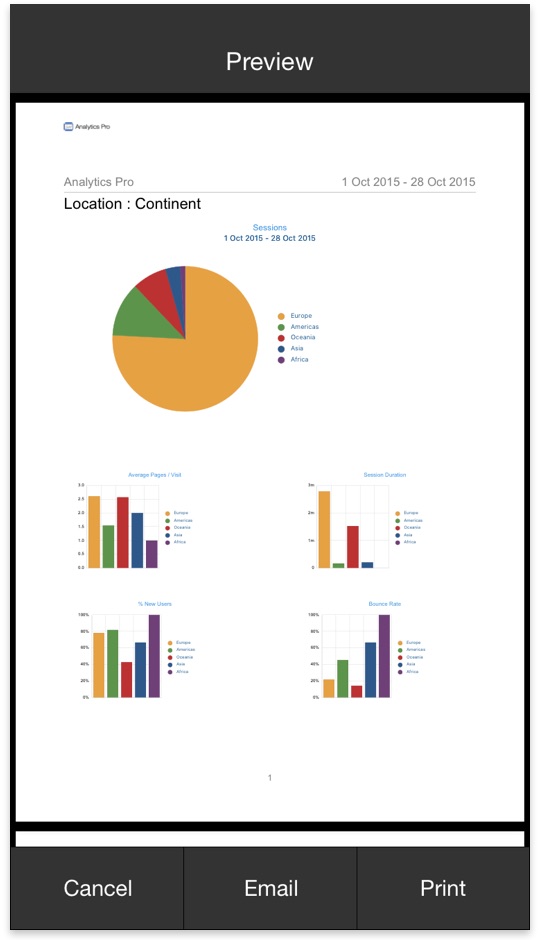
Reports can also be emailed as a PDF file and data can be exported to a Text file.
The Date Range for reports can be changed with the intuitive calendar style date range picker.
This allows you to quickly and easily change the start and end date for your analysis.
AirPrint makes it simple to print reports right from your iPhone or iPod touch.
A few taps is all it takes to go from viewing it onscreen to holding a printed copy.
The Summary report gives you a snapshot of recent visitor activity on your site.
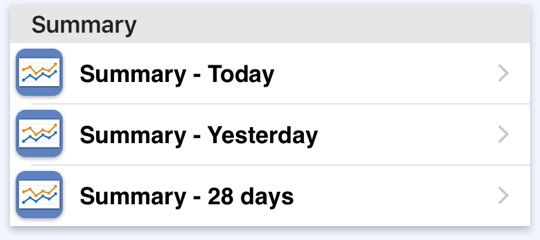
The Summary Reports include:
Reports for Today and Yesterday show hourly graphs and summary data.
The third Summary Report uses a preset or custom date range and shows daily graphs and summary data.

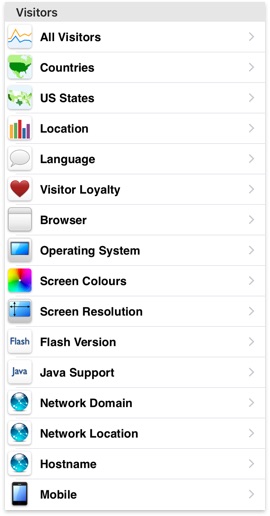
With 16 reports to choose from, you can gain a complete understanding of the visitors to your website such as:
The All Visitors report to explore Daily and Hourly trends.
The Countries & US States reports visually explore data using maps.
The Location report to identify the Country, Region and City of visits.
The Visitor Loyalty report helps understand in more detail the nature of repeat visits to your website.
The Browser, Operating System, Screen Colors, Screen Resolution, Flash Version & Java Support reports help understand what technology is used to access your website.
The Mobile report identifies whether visits are from mobile or desktop devices.
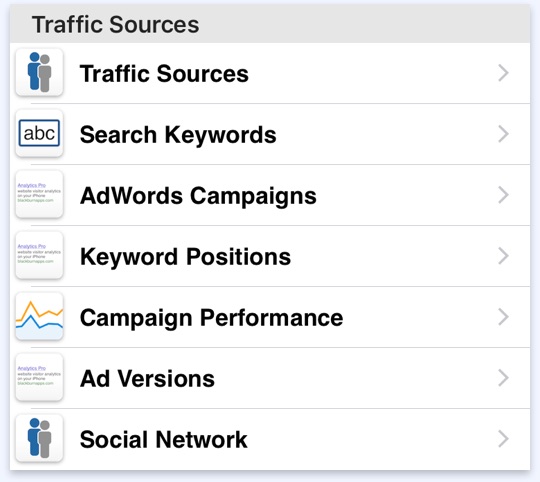
Traffic Sources show where your visitors come from, including links that display the actual web page that your visitors came from.
Identify the Search Keywords visitors are using to find your site.
Adwords Campaigns summarizes key metrics for your Adwords Campaigns.
Keyword Positions shows metrics for Ad Slot, Keyword and Ad Position.
Campaign Performance shows Daily Trend Graph for CPM/C, CTR, Ad Cost, Impressions & adClicks.
Ad Versions summarizes Ad Content for each Campaign.
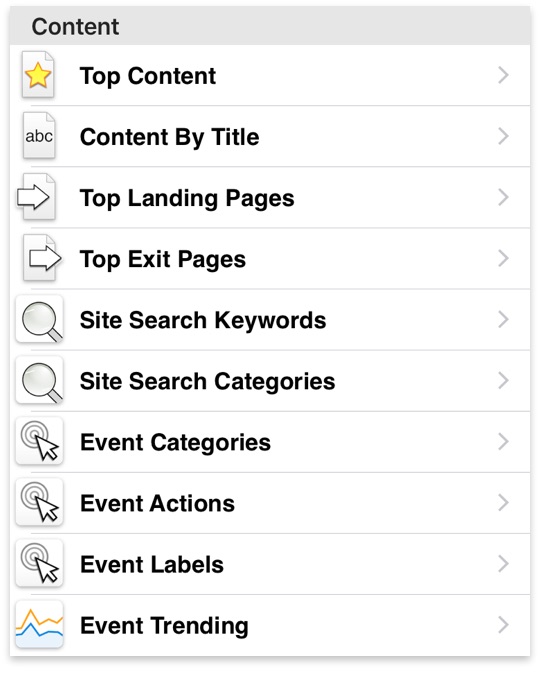
Identify which content is viewed by traffic to your website with four reports.
View visitor metrics for site Search Keywords and Categories
Event Information can be viewed as separate Categories, Actions or Labels, with drill a down option to refine your analysis.
Event Trending shows a daily trend graph of Events. Select any day to drill down and view your Event Categories, Actions and Labels for the selected day.
Reports for Today and Yesterday showing hourly graphs and summary data.
Report for a preset or custom date range showing daily graphs and summary data.
The Summary Reports include:
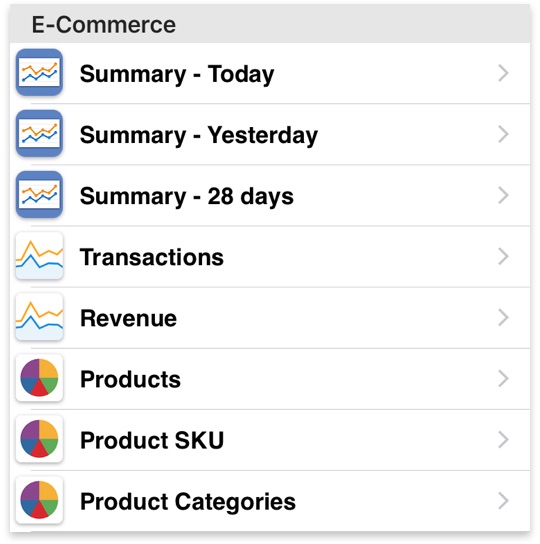
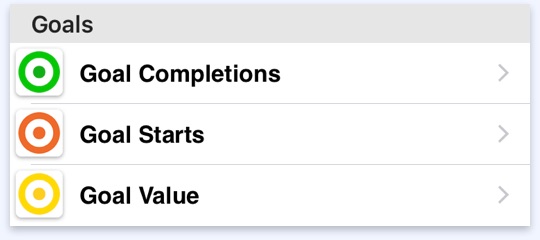
The Transaction report shows the Daily Trend Graph. Drill down through your data to see the Transactions and Purchases for any day. Includes:
The Revenue Reports includes:
Individual Summary Reports for Products, SKUs and Product Categories.