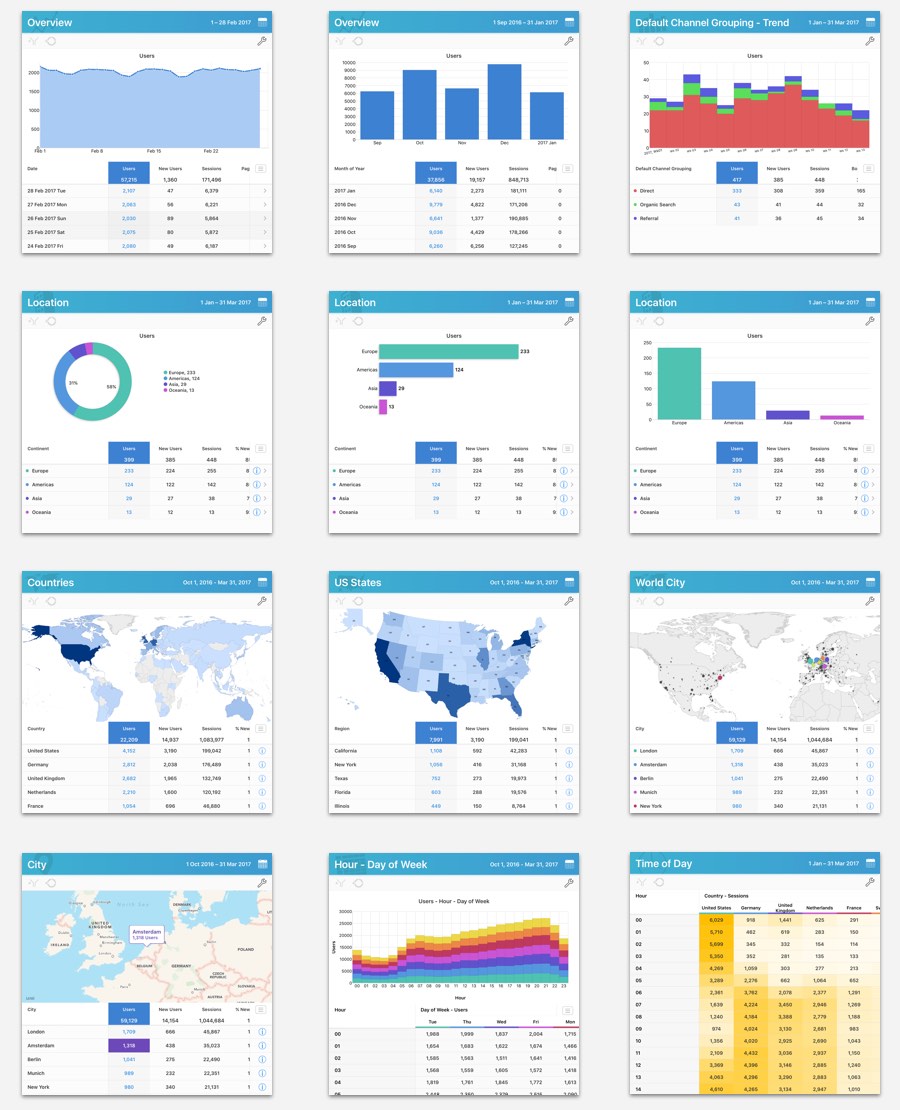
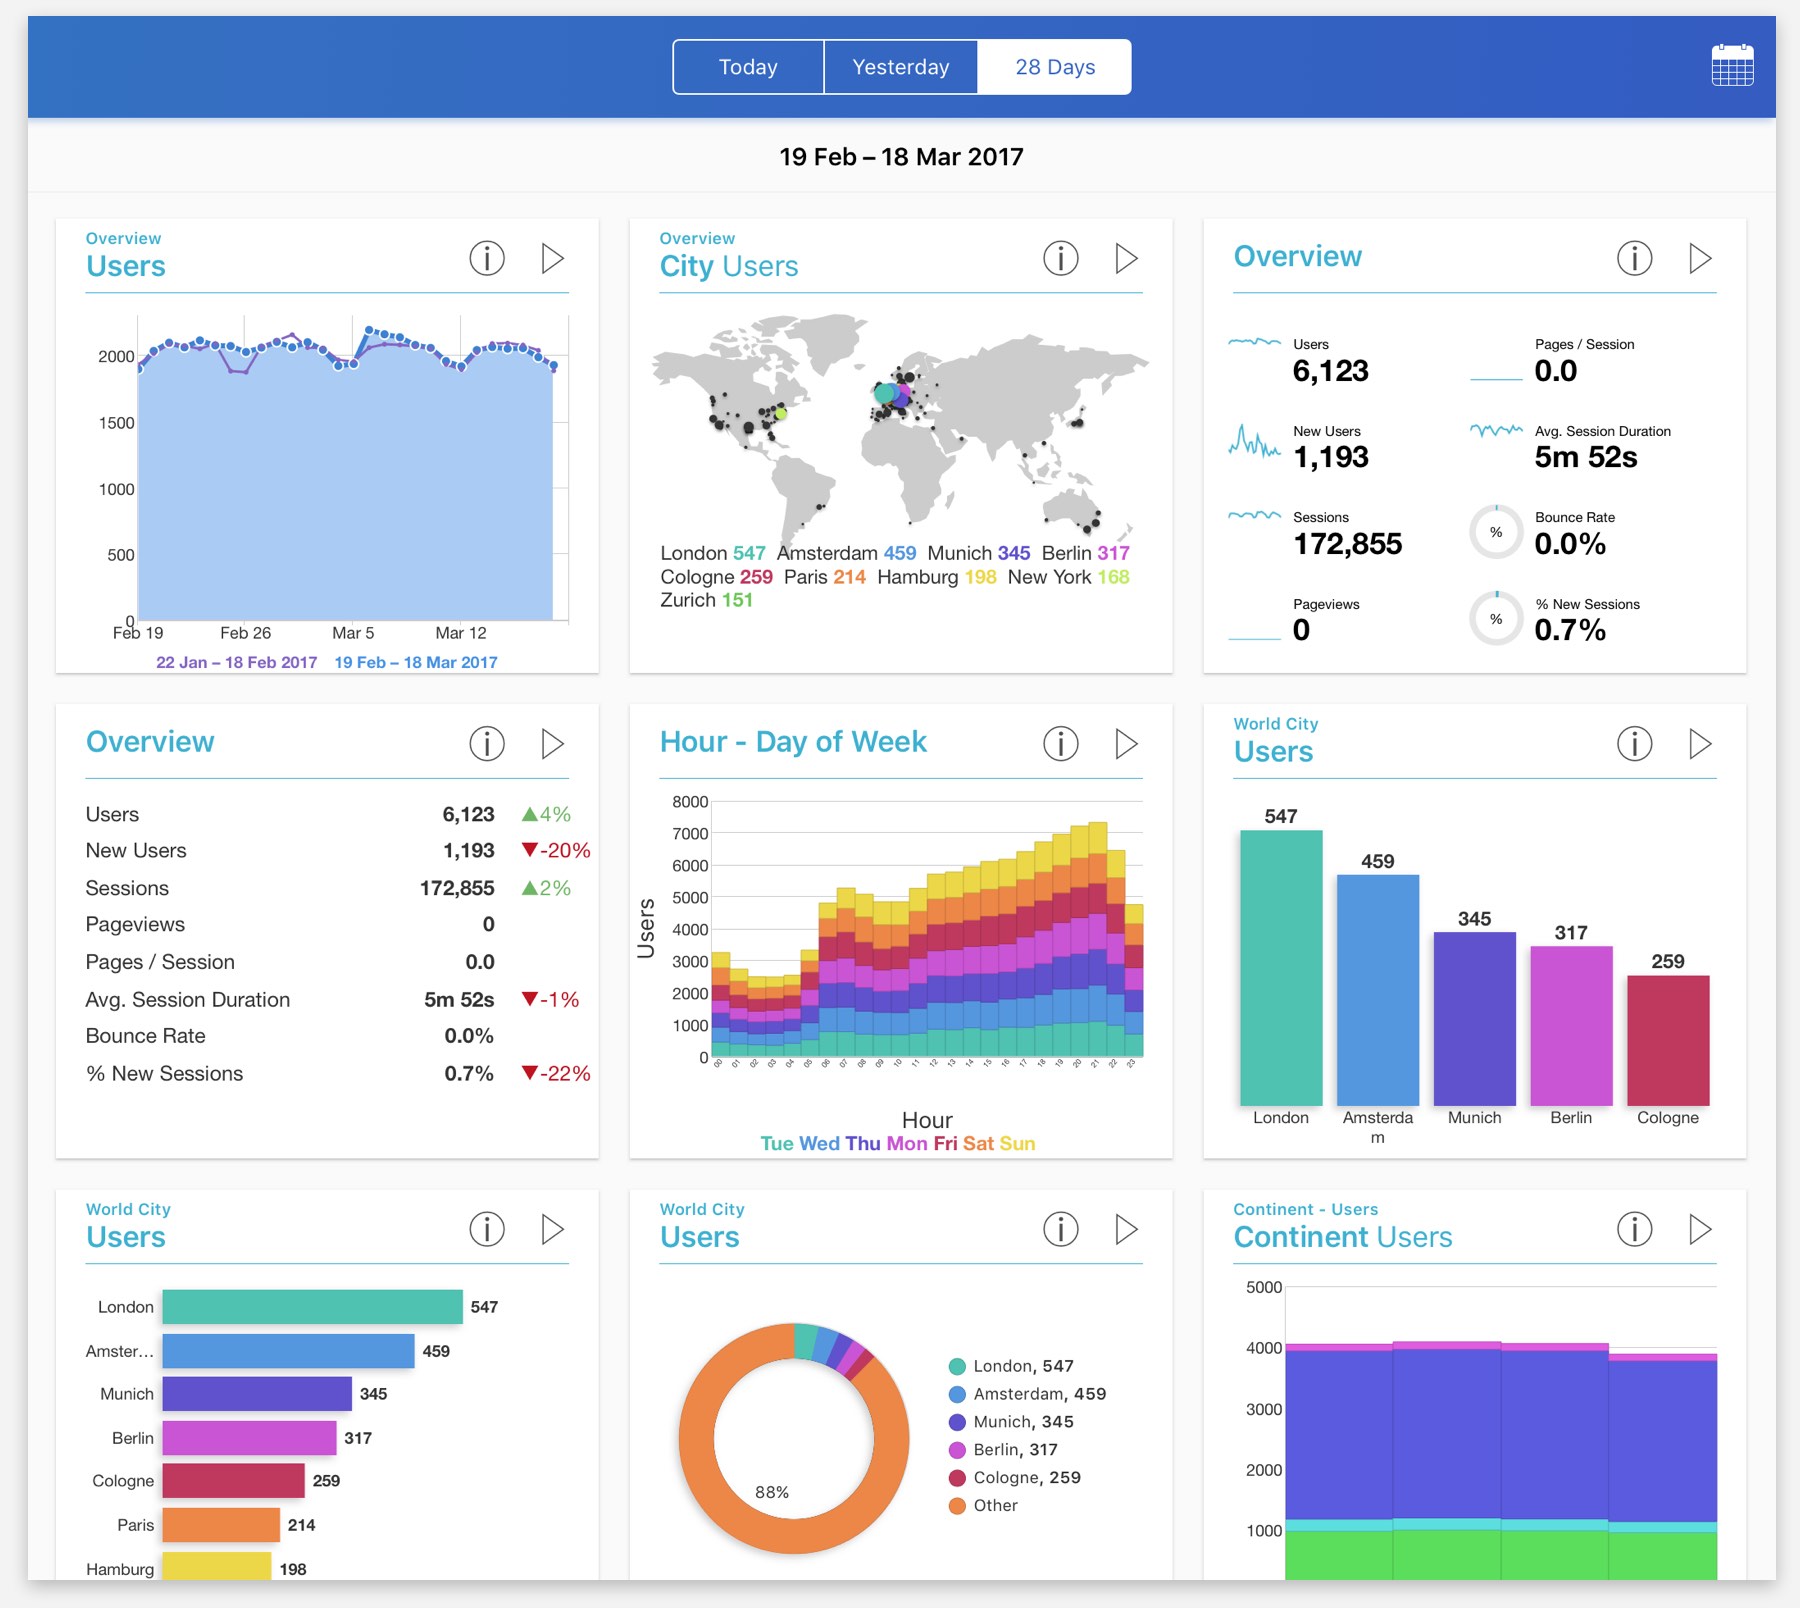

Six customizable Dashboards provide a summary of all aspects of your data with rich visualization and customization options.
Each cell on the dashboard provides quick access to a detailed report for more detailed drill-down and analysis.
13 Different Cell Styles are available giving a clear summary that suits the type of data being reported.
Each Dashboard is fully customizable and can be modified to suit your specific needs.
Each cell's Metrics, Filters and Segments can be added or removed.
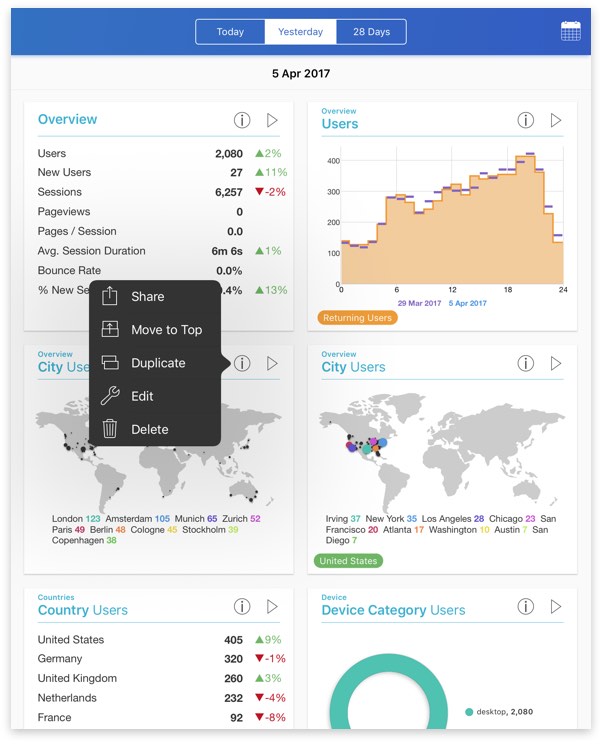
Some cell types provide a visual indication to compare the current time period with a previous time period such as previous day/previous week.
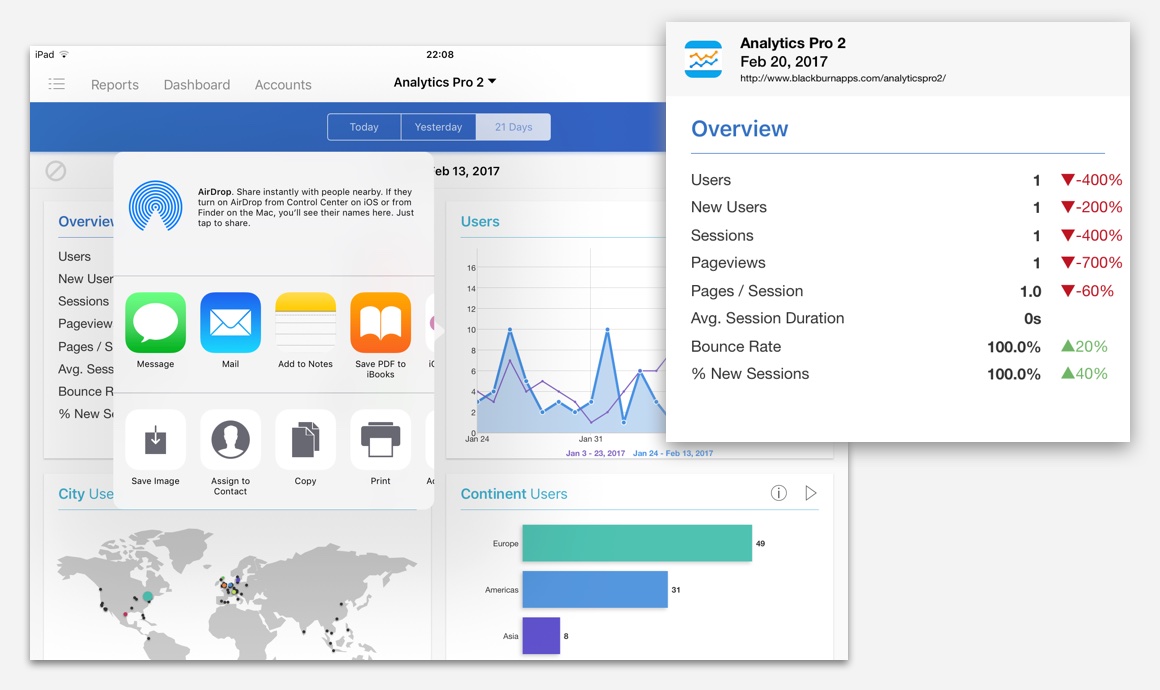
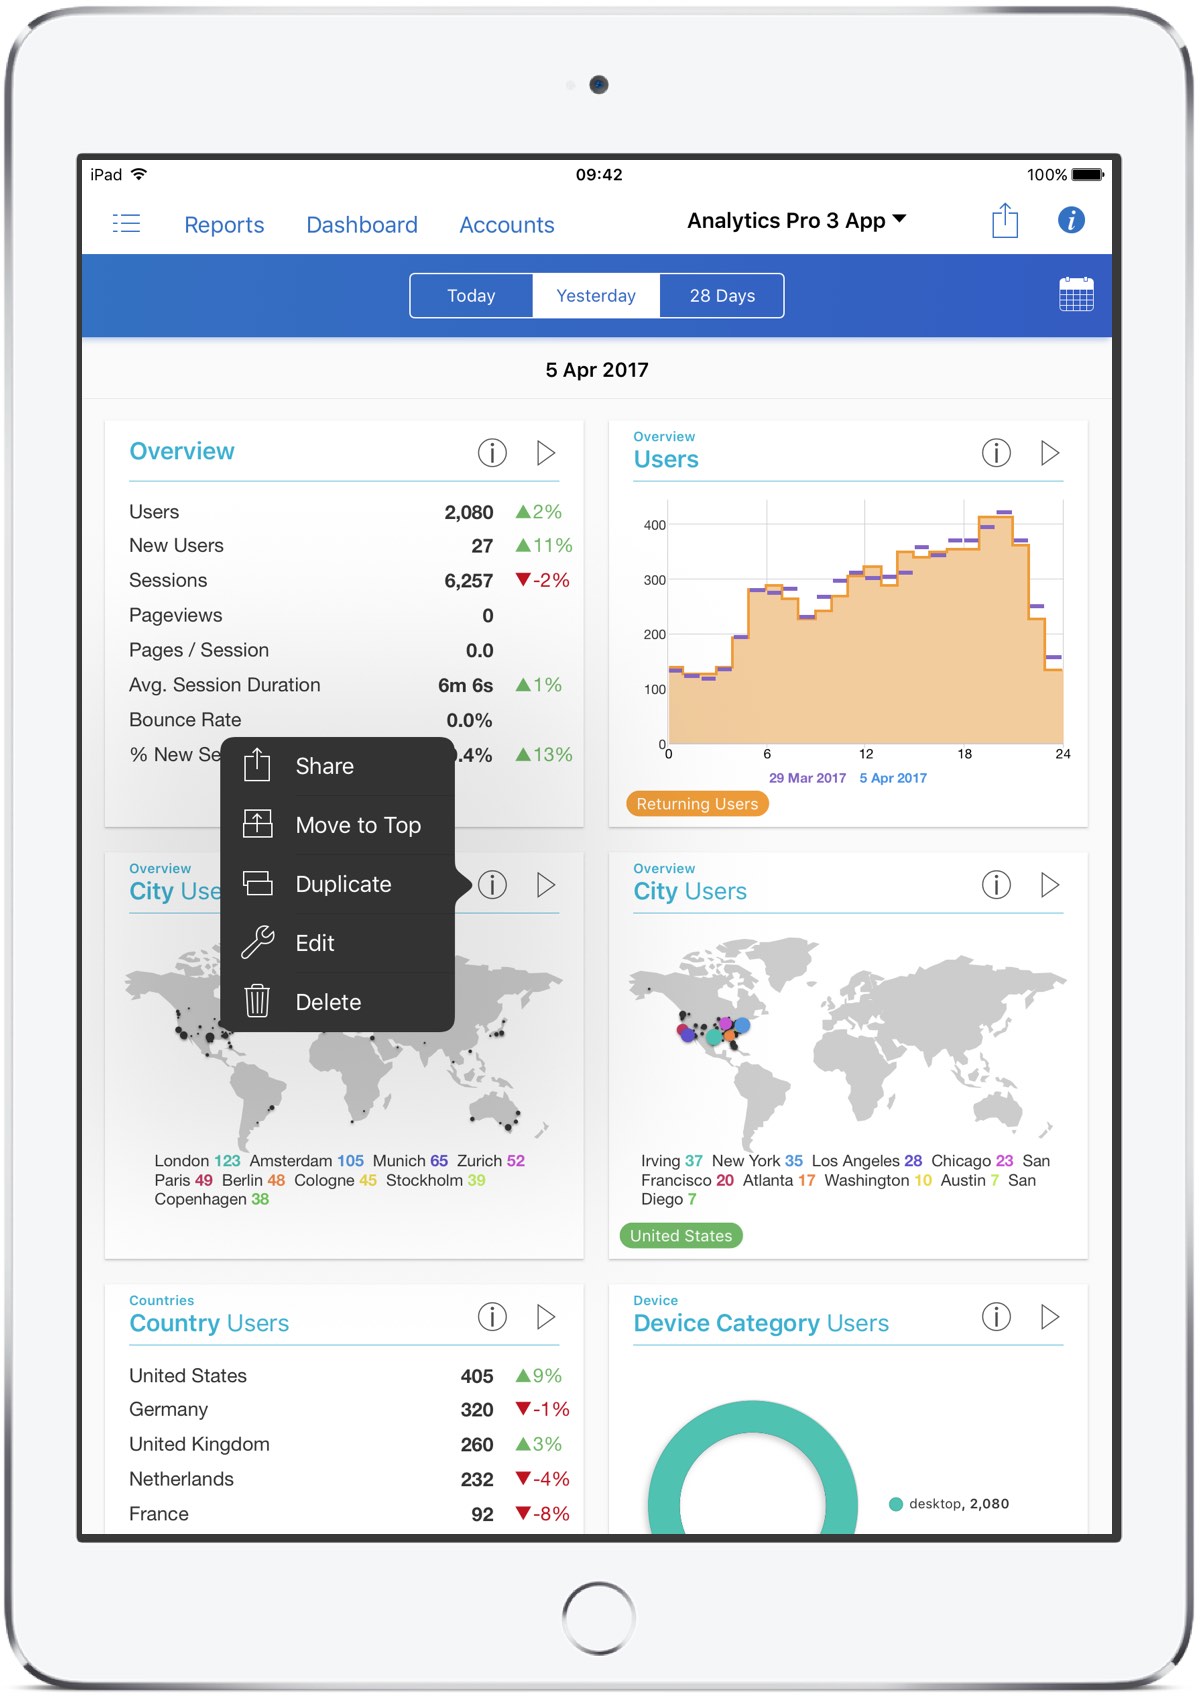
Share allows you to share the cell as an image using the standard iOS share sheet to email and social networks.
Move to Top provides a convenient way to move a cell to the top of the Dashboard.
Edit is used to adjust the metrics, filters and segments applied to a cell.
Duplicate is used to copy a cell. Awesome for making a cell with different metrics, filters or segment.
Re-order a cell using a long press, followed by dragging the cell to the new location.
Each cell on the dashboard links to a full report via the 'triangle' button located top right of each cell.
This provides a quick and convenient way to view a detailed report allowing the underlying data to be inspected in more detail.
Reports in Analytics Pro 3 have an option + Add to Dashboard which makes is easy to add new cells to a Dashboard.
When this option is selected, a range of compatible cell styles is displayed for selection.
The metric displayed in the cell can be quickly changed using a full screen selection UI. Just tap a cell to make a change.
Scrolling cells allow left or right swipe gestures to change the metric displayed in a cell.
The latest Analytics API v4 is used to take full advantage of the most advanced features of Google Analytics™.

There are 101 Standard Reports organized into 5 Sections: Audience, Acquisition, Behaviour, Conversions and App Tracking.
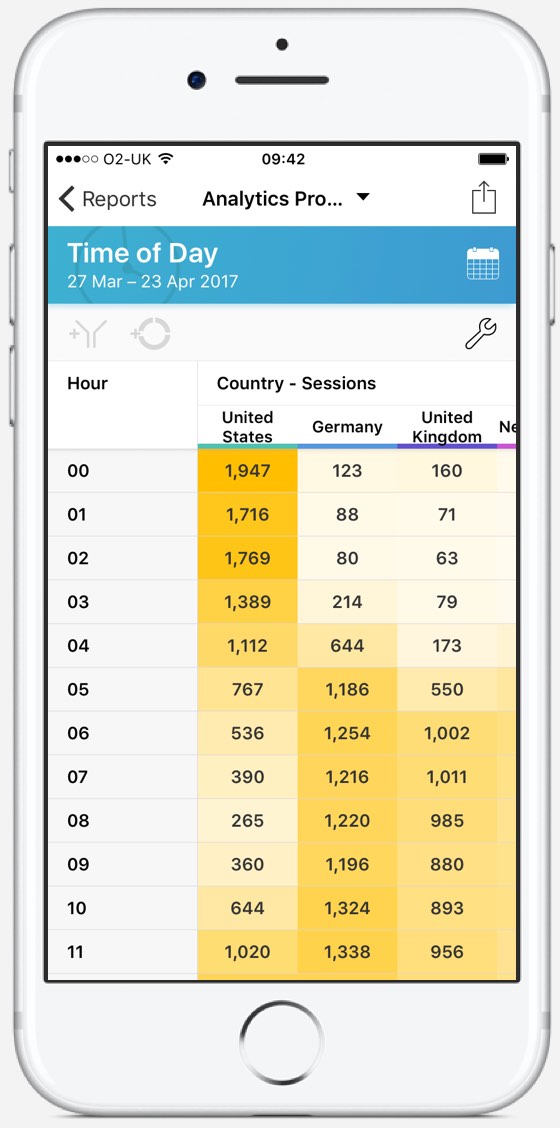
9 report types help you understand your Analytics data using interactive Graphs, Maps, Pivot Tables, Spreadsheets and Heat Maps.
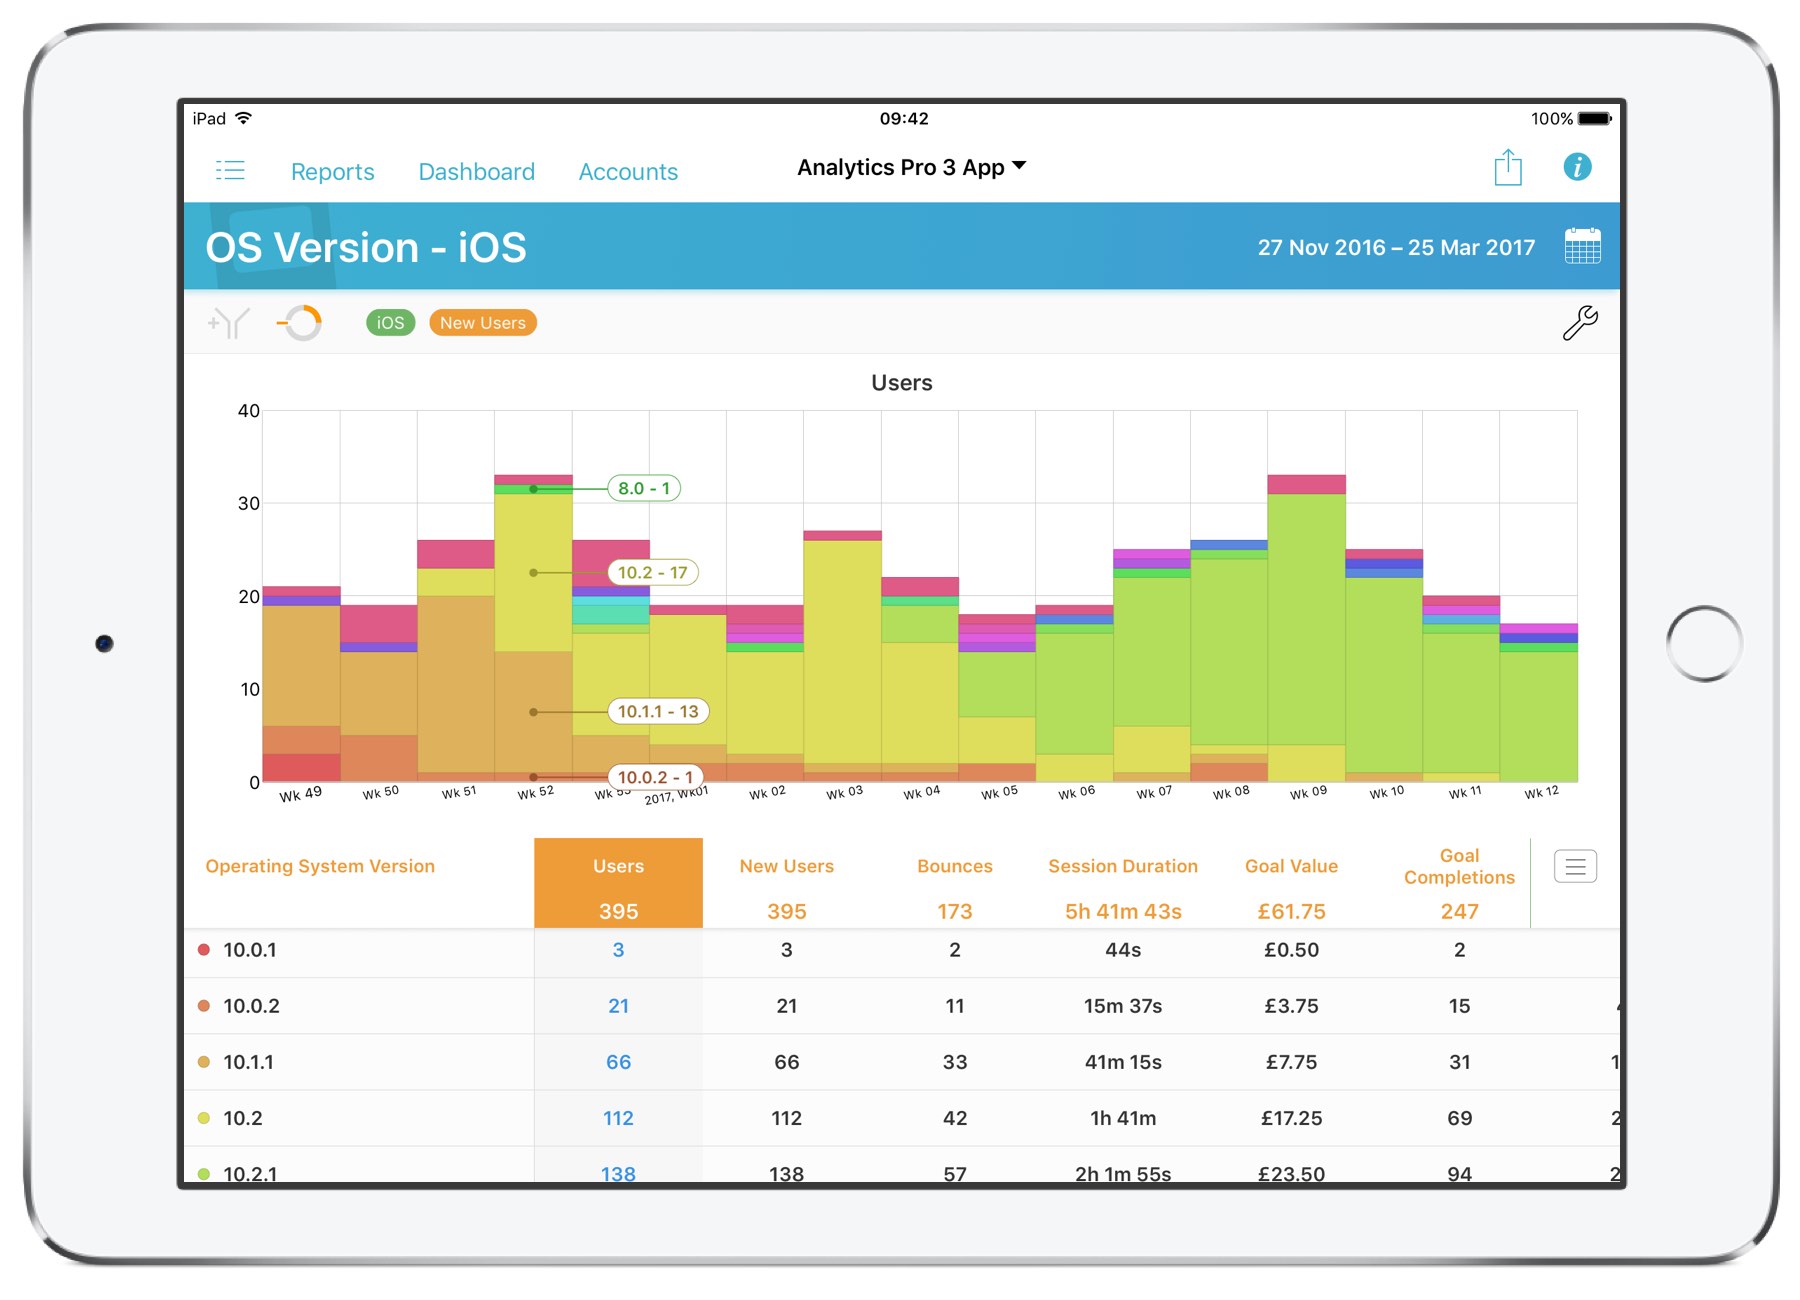
A Spreadsheet style table is used to display tabular data for a report, optimizing use of screen space on all devices.
It allows simultaneous display of multiple metrics and fast switching between the displayed metric.
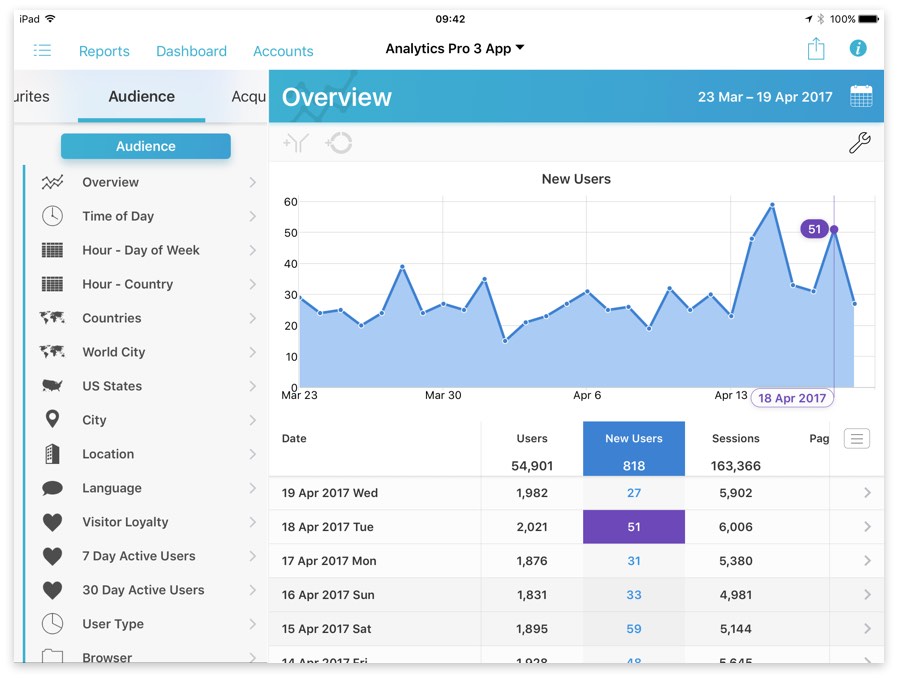
Interactive graphs and tables let you identify data point values by simply touching them.
Tapping on a line graph will display the numeric value of a point and reveal the data by scrolling to it in the table.
Adjust the screen split to give more room to the graph or to the data.
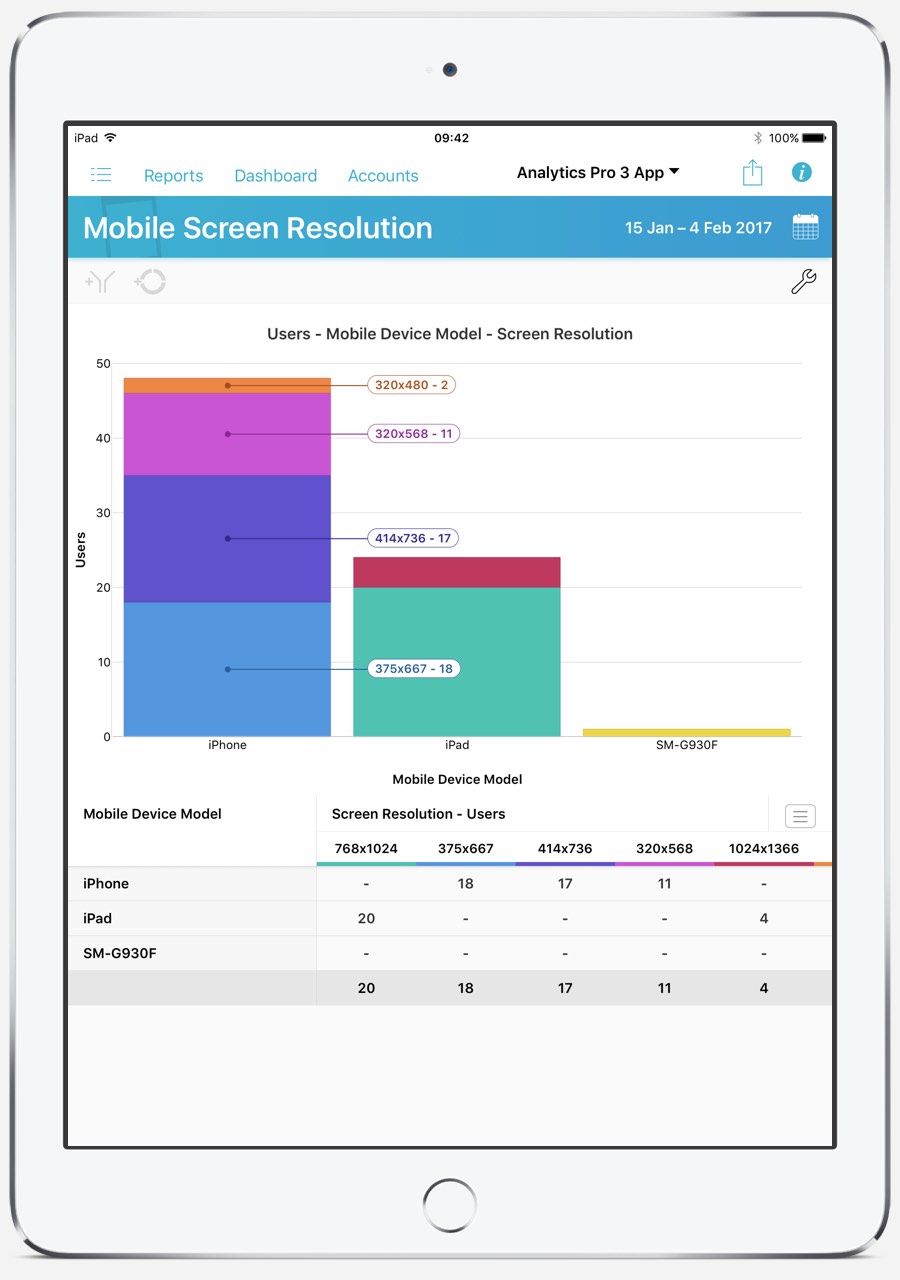
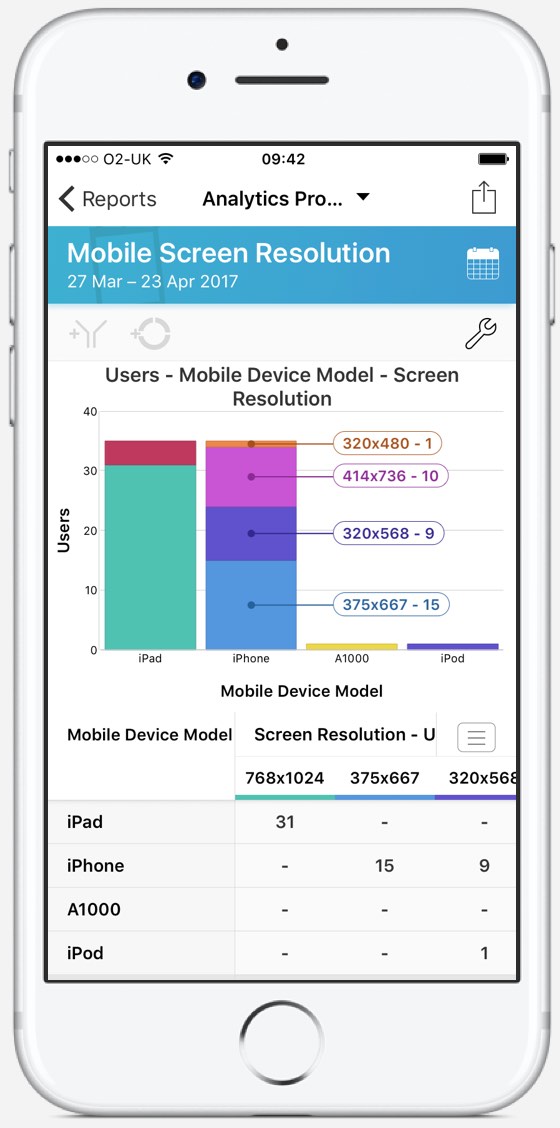
The new Pivot Table report allows a dimension and metric to be pivoted against a second dimension. This provides deeper insight into the data whilst displaying it in a single graph and table.
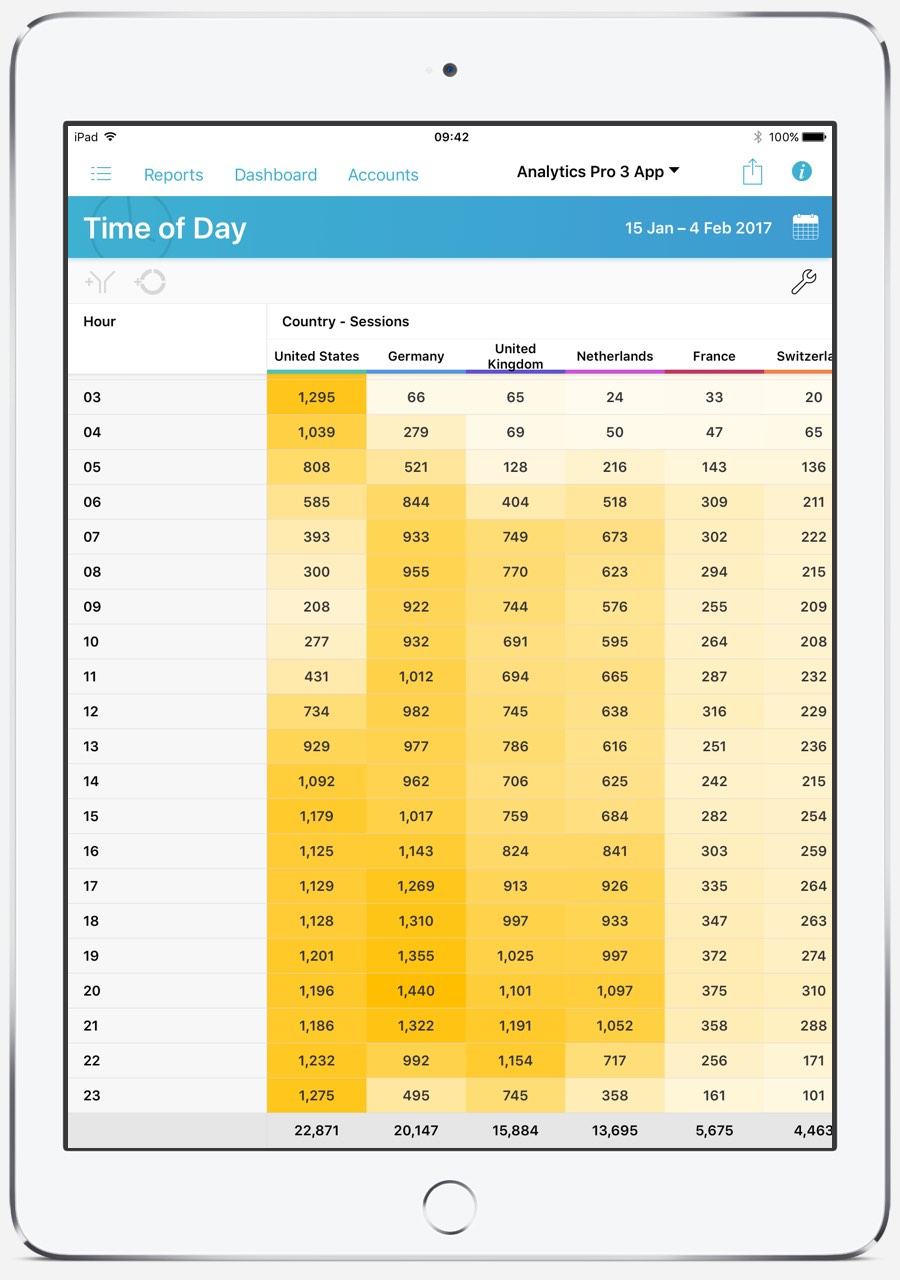
The new heap map report uses the pivot table data, but displays the metric values with varying levels of color intensity. This is useful for determining which two dimension combinations are most dominant.
The Report Menu on the right of the screen facilitates finding and selecting reports. It can be hidden on the iPad to maximize the screen available for displaying reports.
On the iPad, a full screen report menu is available making report selection from the large number of available options easier.
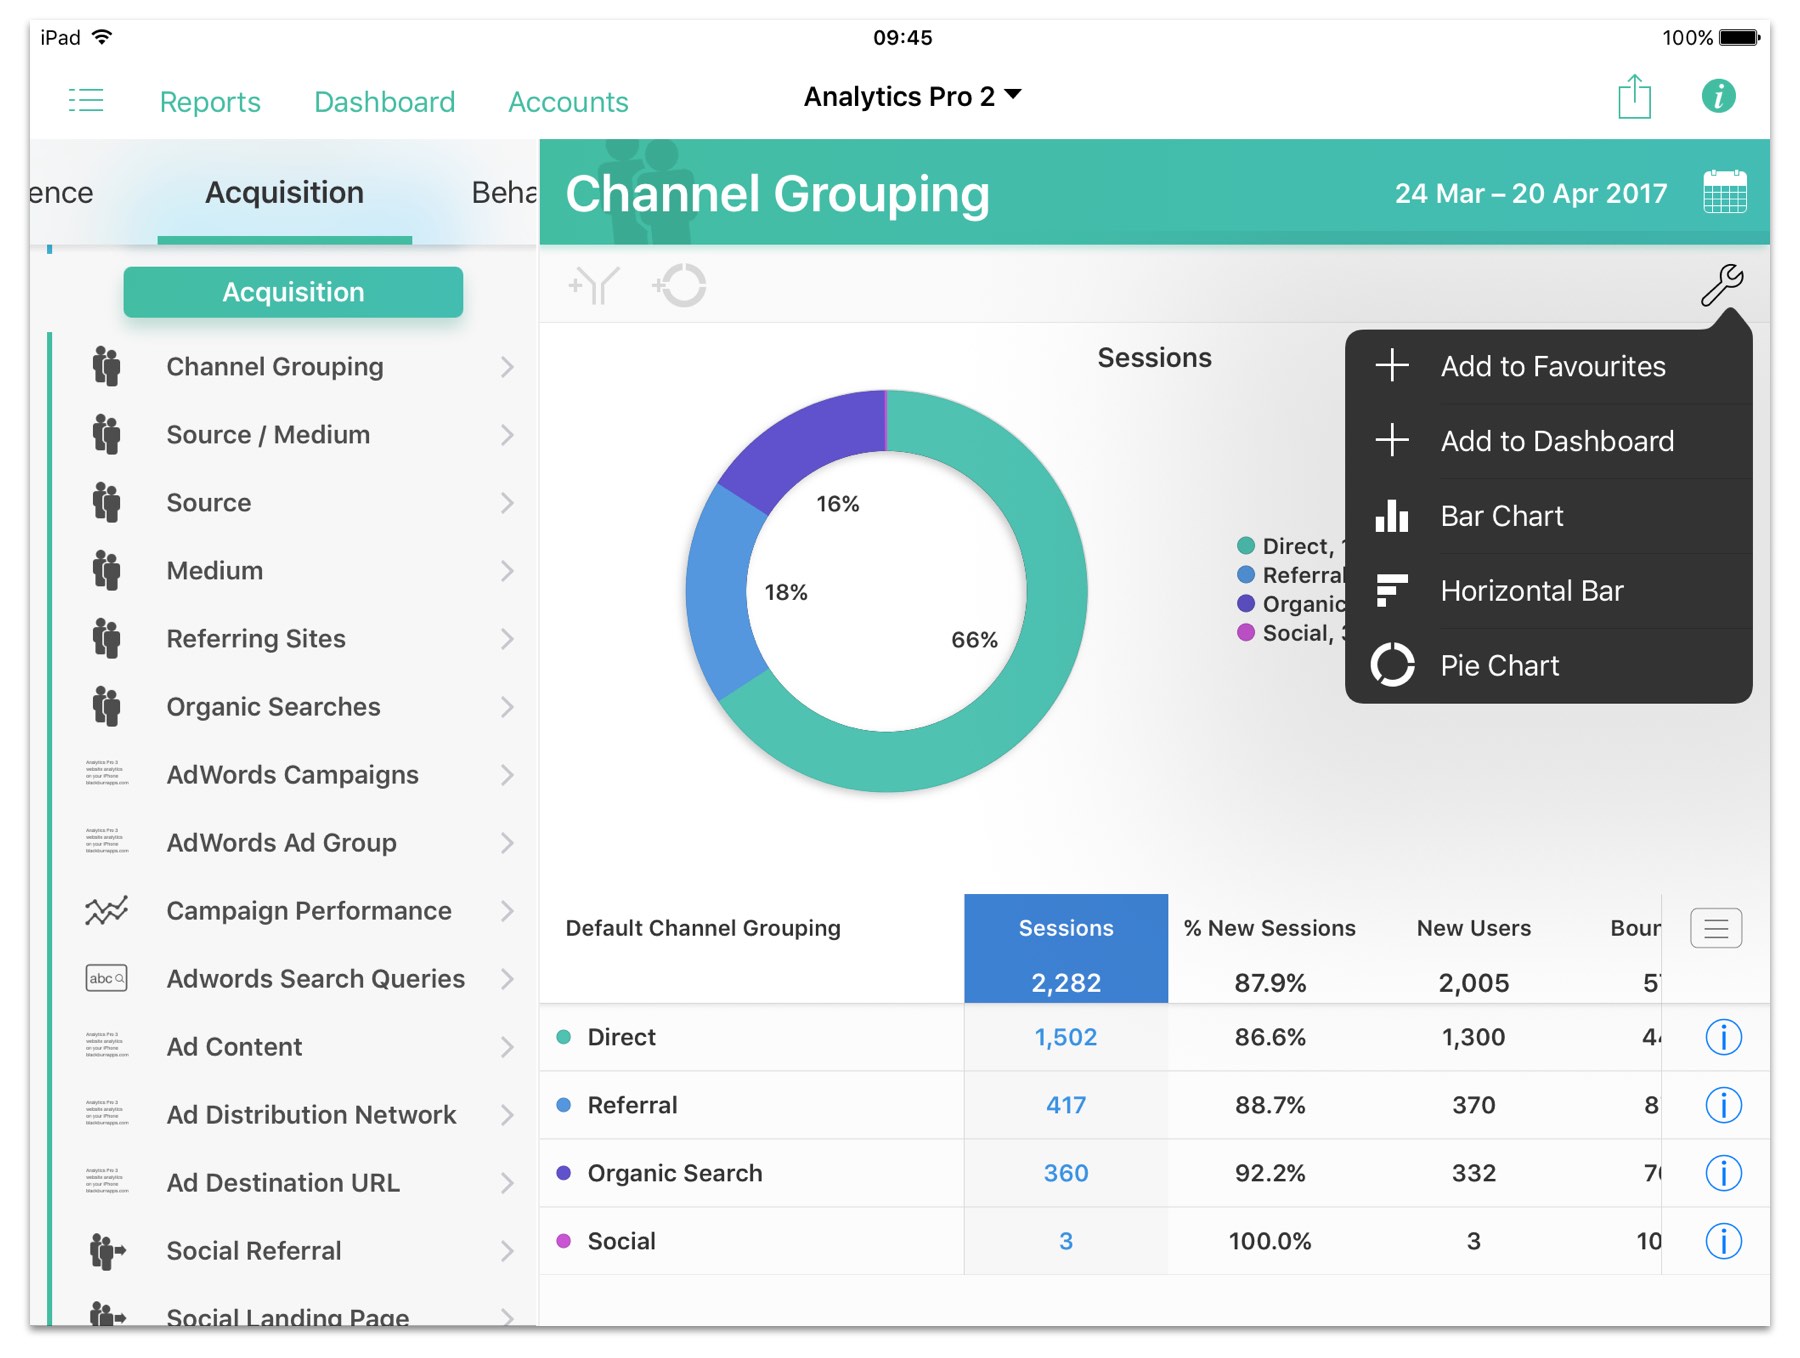
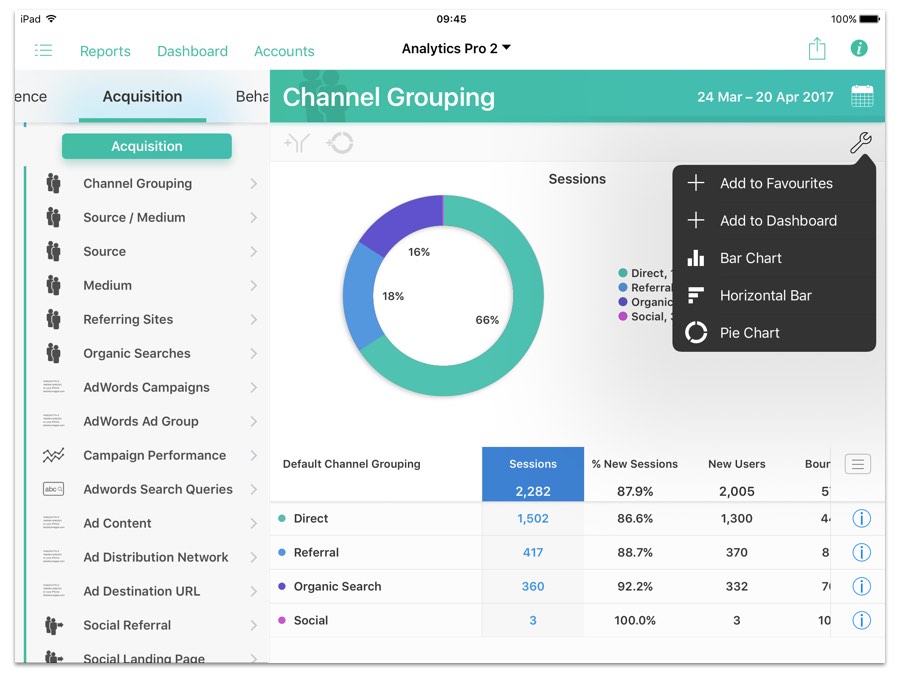
A settings menu also allows quick access to additional functions.
Add to Favorites adds the report to the Favorites section of the reports menu for convenient access.
Add to Dashboard allows a report to be added to a dashboard.
The settings menu allows adjustment of graph settings. The graph can changed to Bar Chart, Horizontal Bar or Pie Chart.
Reports with a time dimension can be changed to either Day, Week or Month.
Use iCloud to syncronize dashboard and custom reports between your iOS devices.
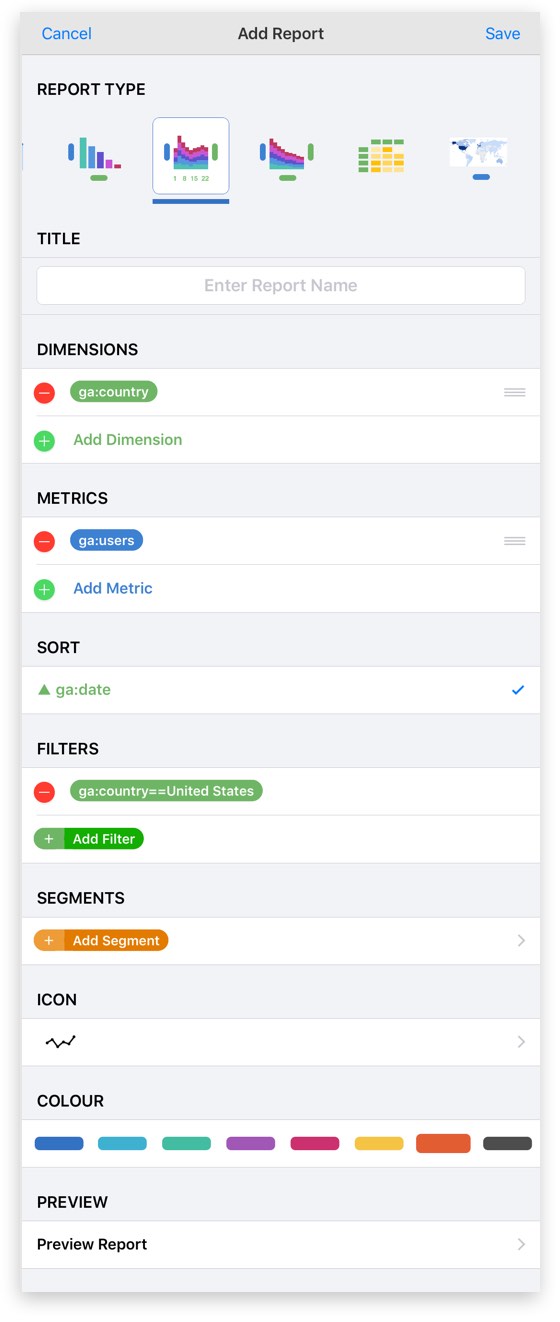
Create your own custom reports using 9 optimised templates for different types of analysis.
It is easy to create a report. Simply choose a report type, add metrics and dimensions (if required), then Save.
Some reports let you choose the sort options for the dimensions and metrics.
Filters and Segments can be added to a custom report, to achieve a focused analysis.
Further customize a report by choosing the color and icon used to help identify it in the report list.
Favorite reports can be edited.
This makes it easy to create custom reports, by using a standard report as the starting point.
Save a standard reports to favorites, then edit and make adjustments.

Optimized for all screen sizes, from the smallest iPhone to the largest iPad Pro.
Selecting a row in the data table or the accessory icon will drill-down and allow a more detailed analysis of a specific subset of data.

Clear visual clues let you know when the presented data is affected by filters and segments. Green indicates that a Filter is applied. Orange indicates that a Segment is applied. If a filter and segment are applied simultateously, the dominant color is orange.
Save drill-down filters and easily apply them to other reports and dashboards.
When a row of data in a report is selected for drill-down analysis, the filter being applied is displayed in the toolbar.
Tapping on the green filter displays a menu which allows the filter to be saved to the 'Saved Filters' for later use with other reports.


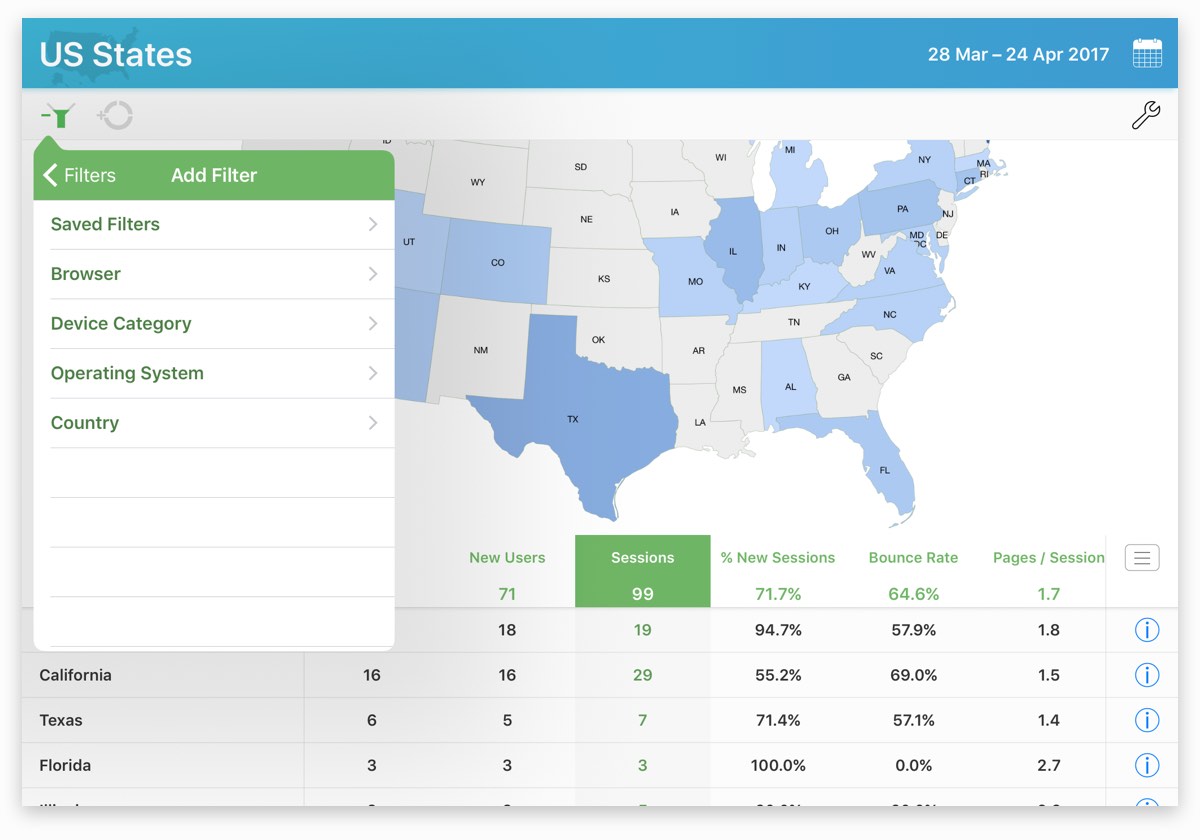
Filters are used to remove unwanted data in order to obtain a better understanding of a subset of data.
They can be applied to dashboards and reports to explore underlying data and trends.
Standard filters are available to isolate subsets of data by Browser, Device Category, Operating System and Country
A report can also be filtered using 'Saved Filters', which are custom filters saved from other reports.
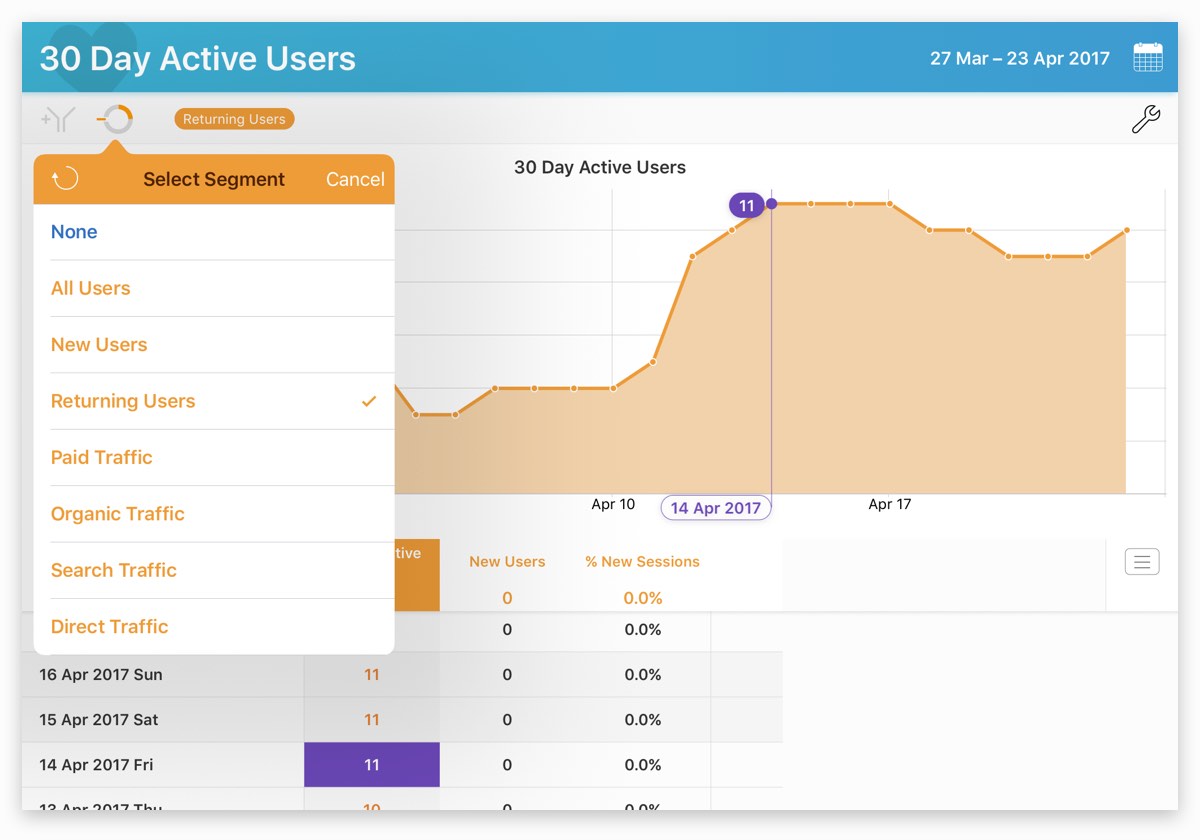
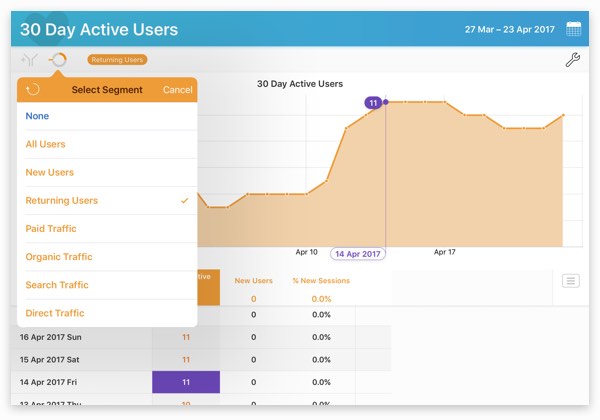
Segments can be applied to reports and dashboards.
To apply a Segment to a report, simply select one from the Segment menu.
An orange color will applied to UI elements to indicate that a Segment has been applied.
Manage multiple Google Analytics™ Accounts and switch between them easily.
Save favorite views for quick access.
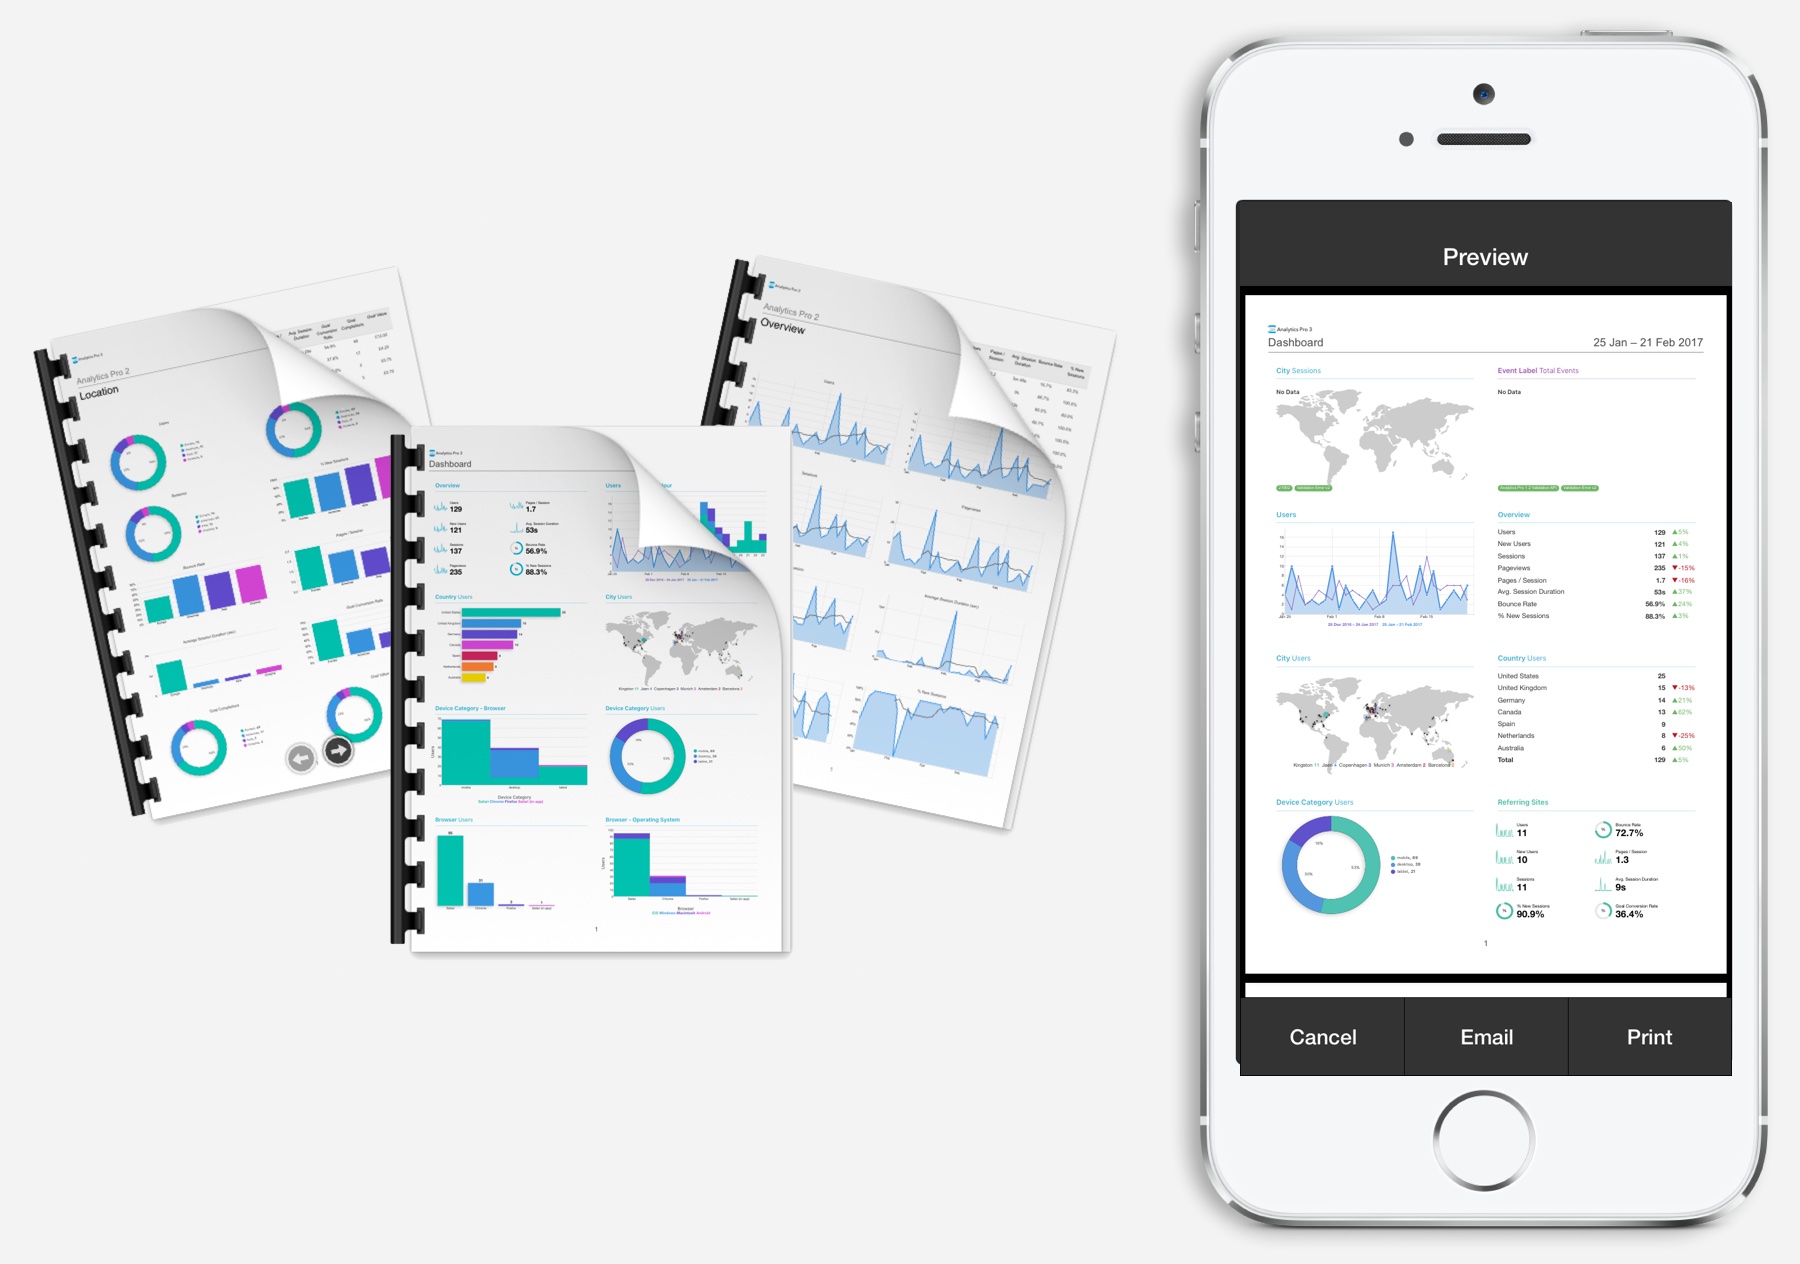
Create high quality PDF documents from Reports and Dashboards.
Documents can be previewed and customized before exporting.
Export raw data from a report as a text file and sent by email.
Send Reports and Dashboards to a printer using AirPrint.
Share Dashboard cells as an image using the standard iOS sharing function.
Analytics Pro 3 supports Peek and Pop on compatible iPhones and lets you preview a report without having to open it.